
The spring market is gearing up and ready to launch. Activity is picking up and expected to be increasing through the late spring months. Below you'll see more of the latest trends and data that set the stage.
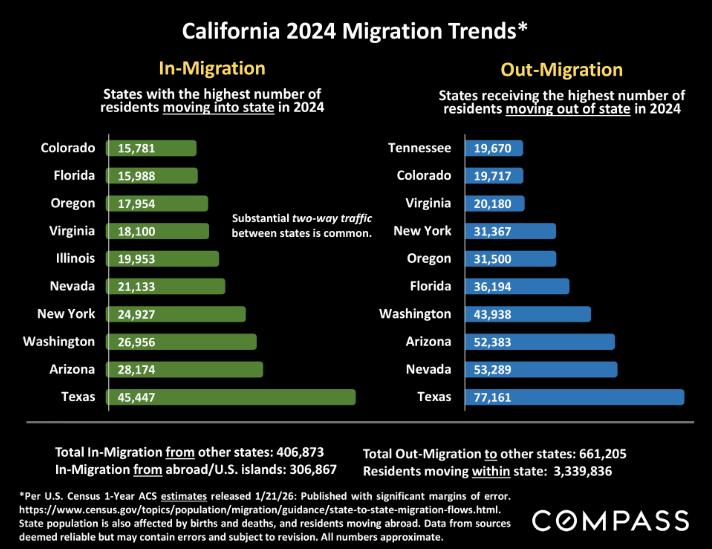
There is a lot of chatter about people leaving California. What is often overlooked is how migration patterns are a two-way street between exit and entrance states. Seeking work and life-style hubs, the pattern shows people are moving between hotspots.
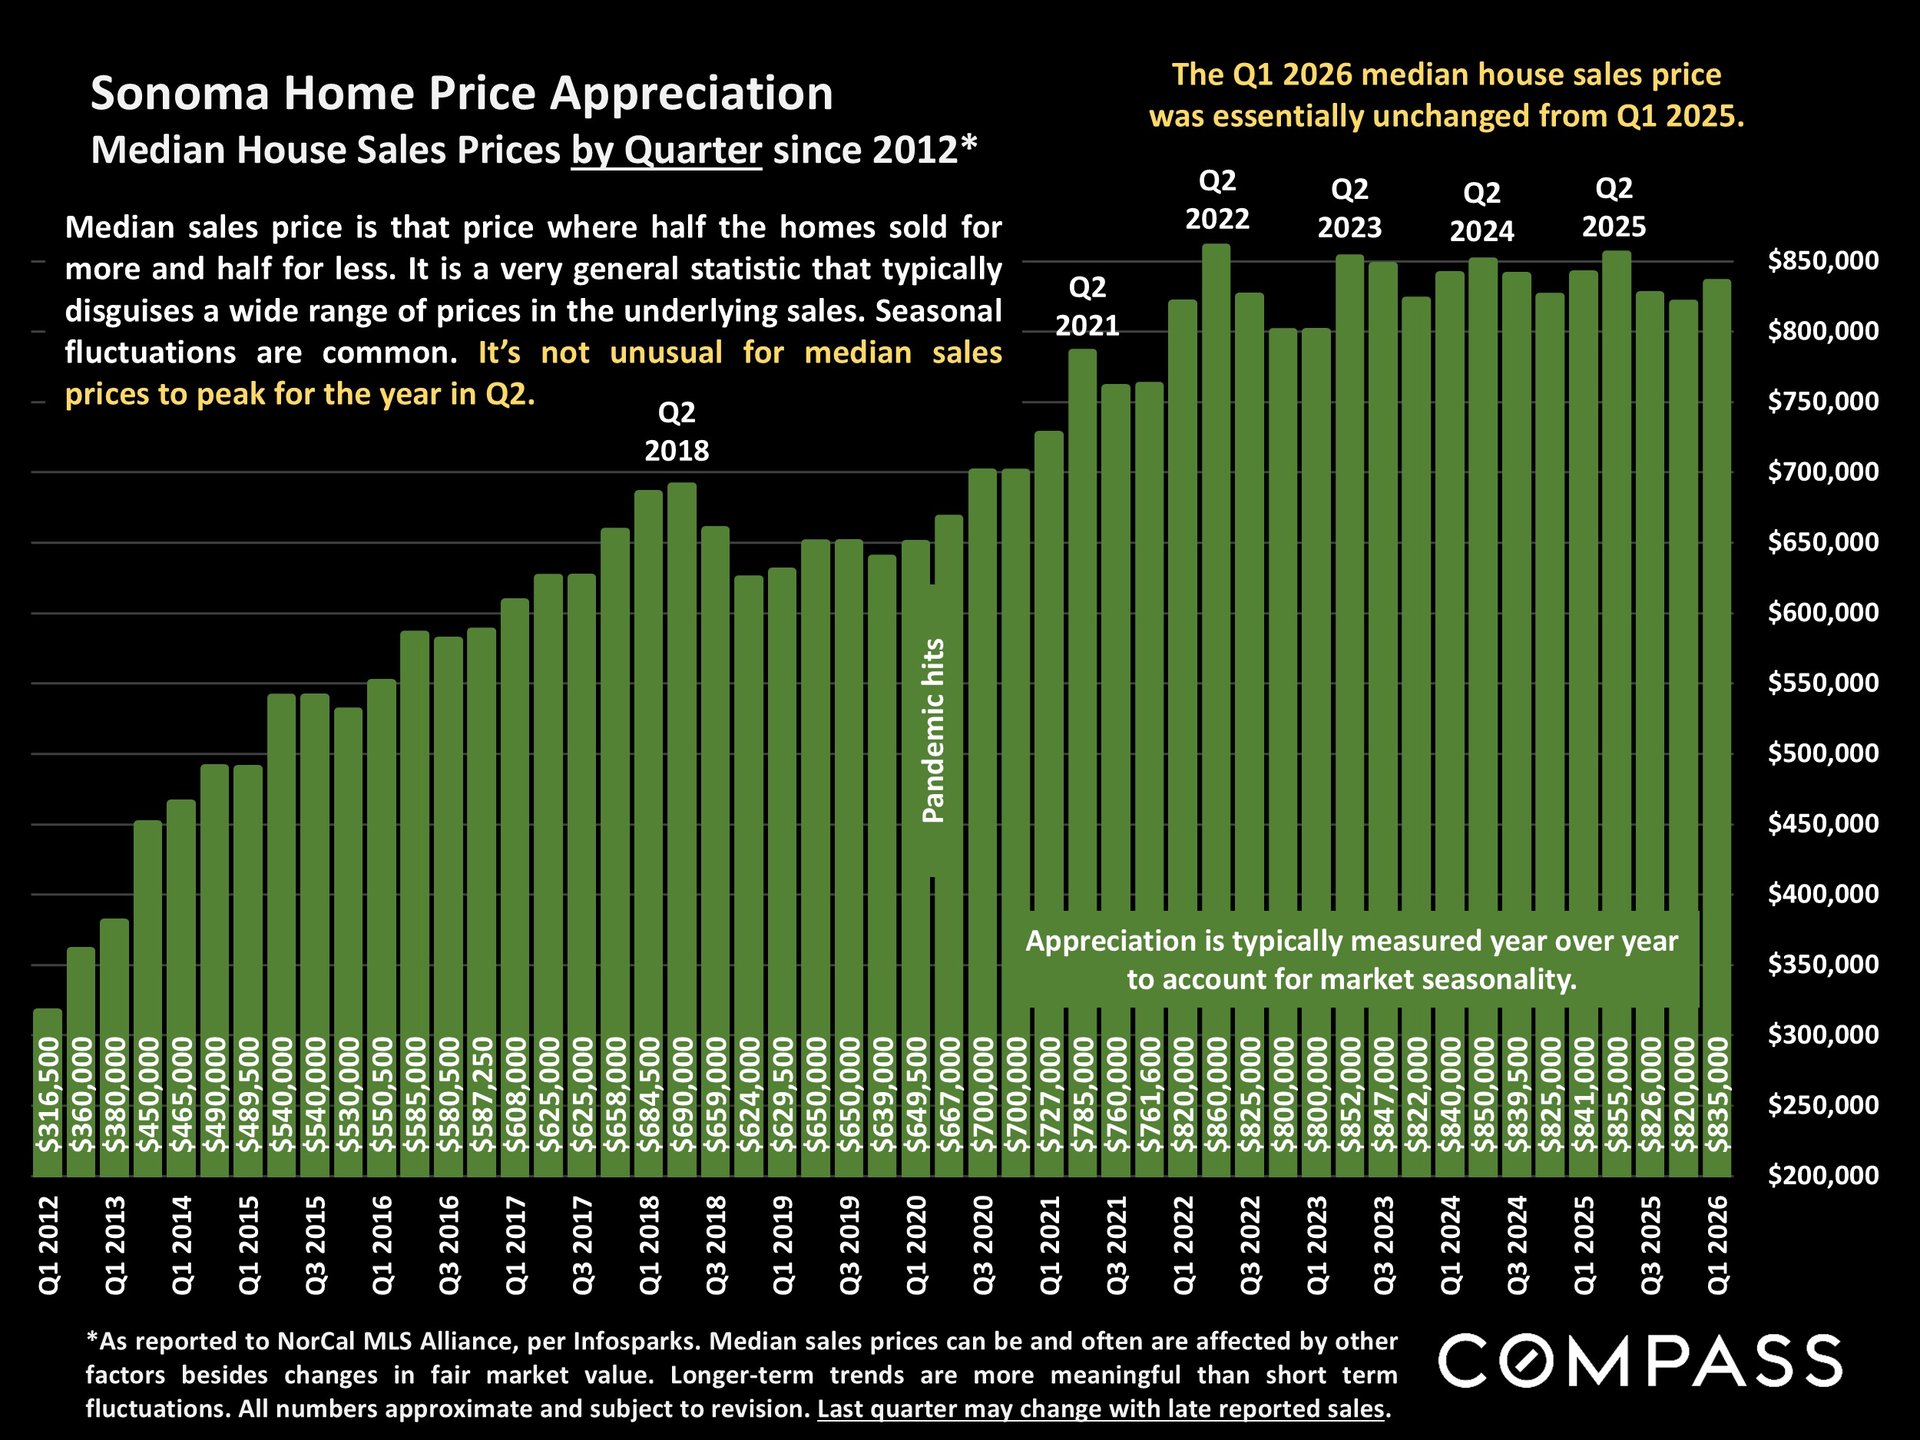
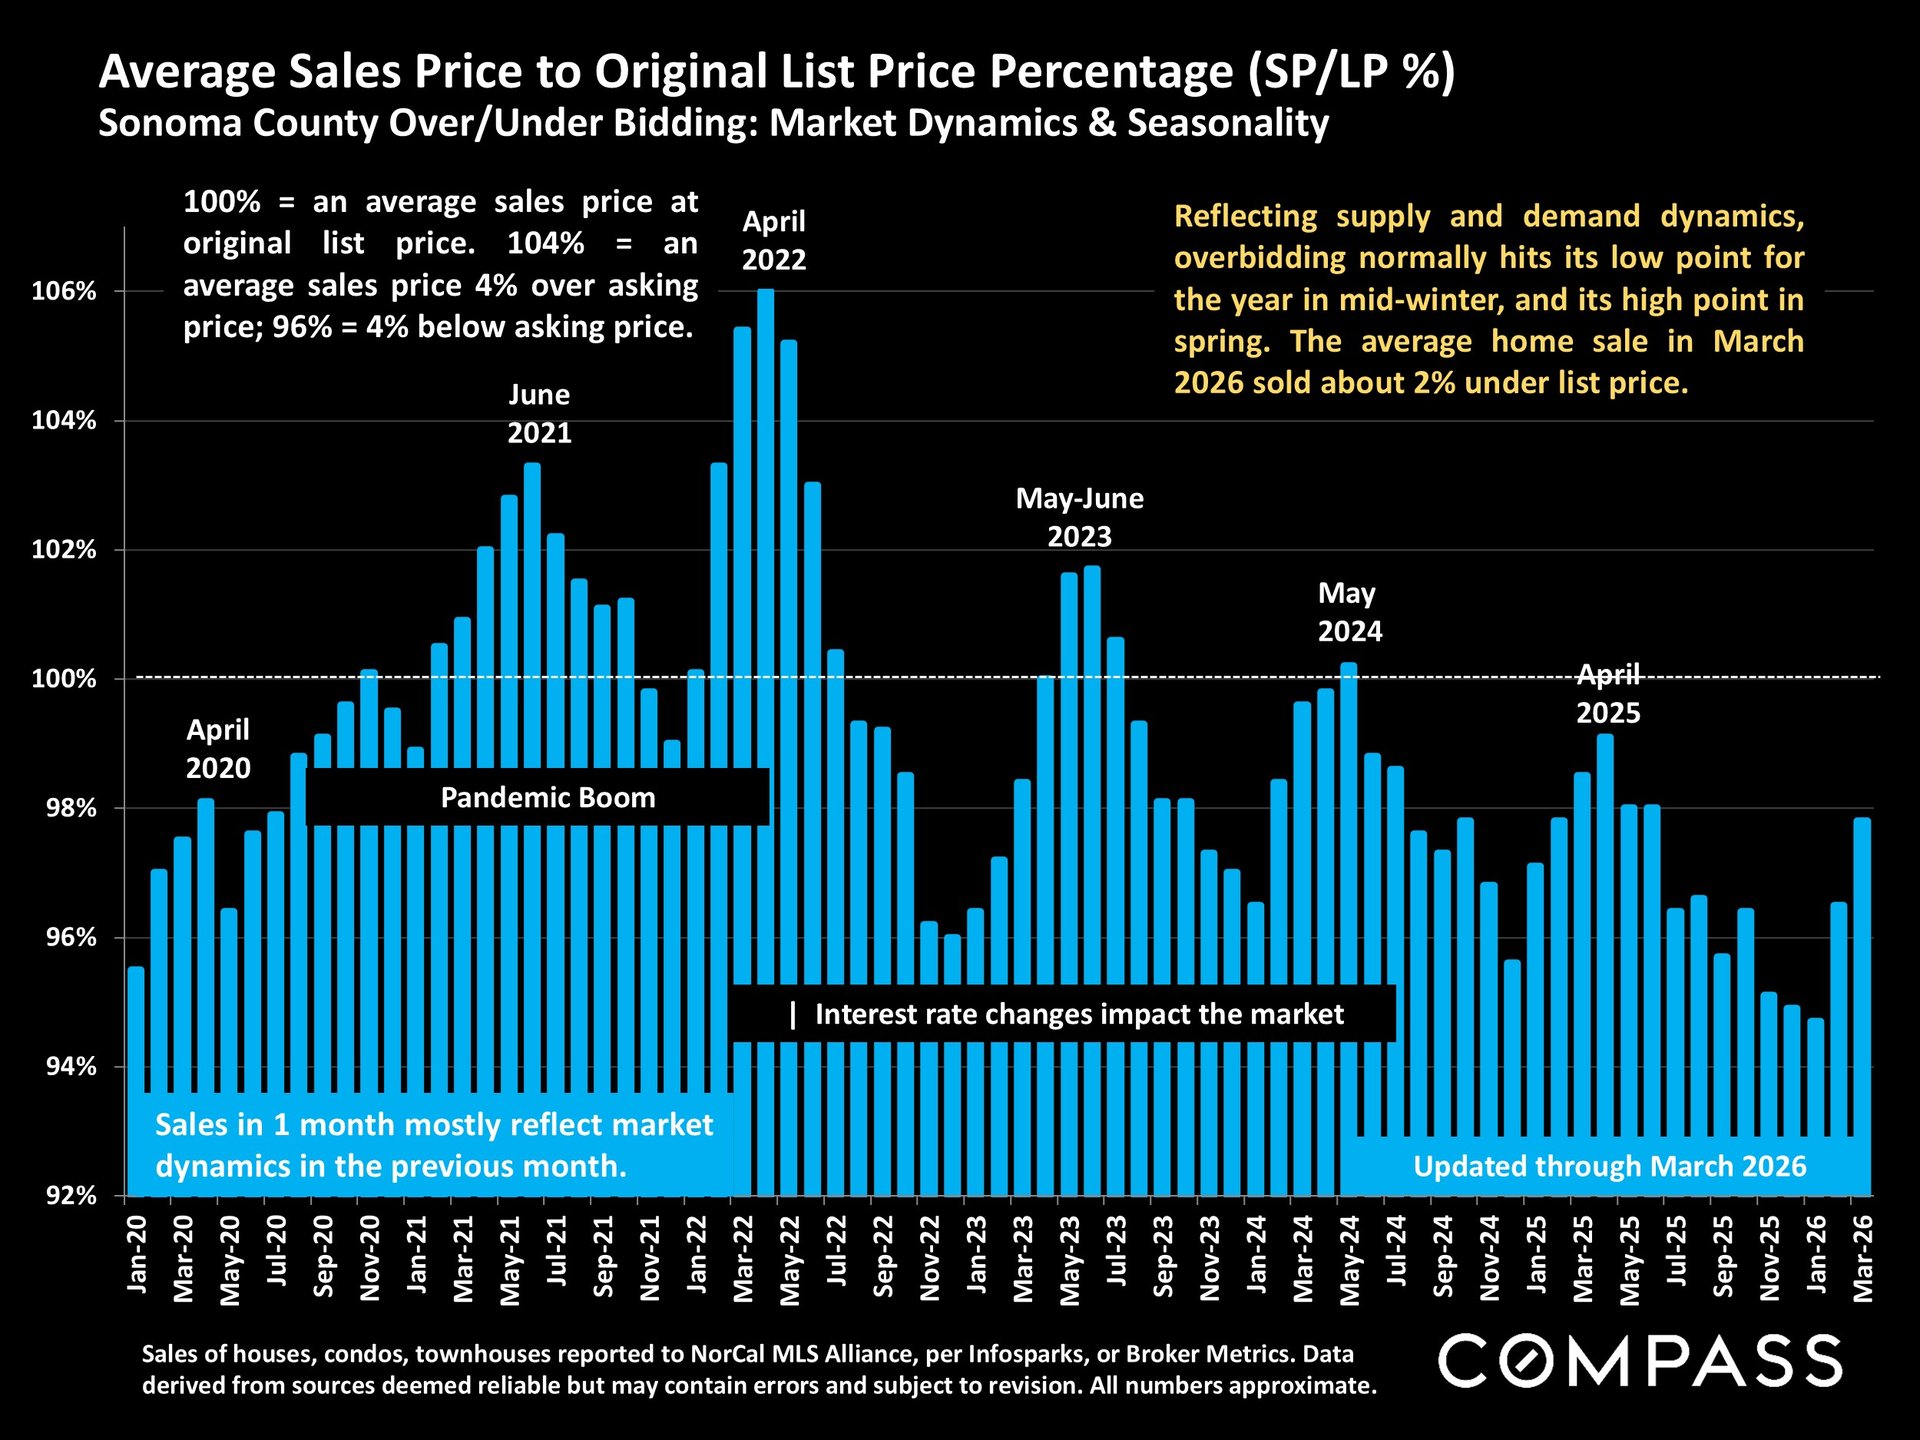
The next few months will further define the state of home prices in the county. Further down you'll see data framing the picture for supply-and-demand. The last few years we've had a "leveling off" of prices after quick price increases between 2019 and 2022. That dynamic appears to continue through 2026.
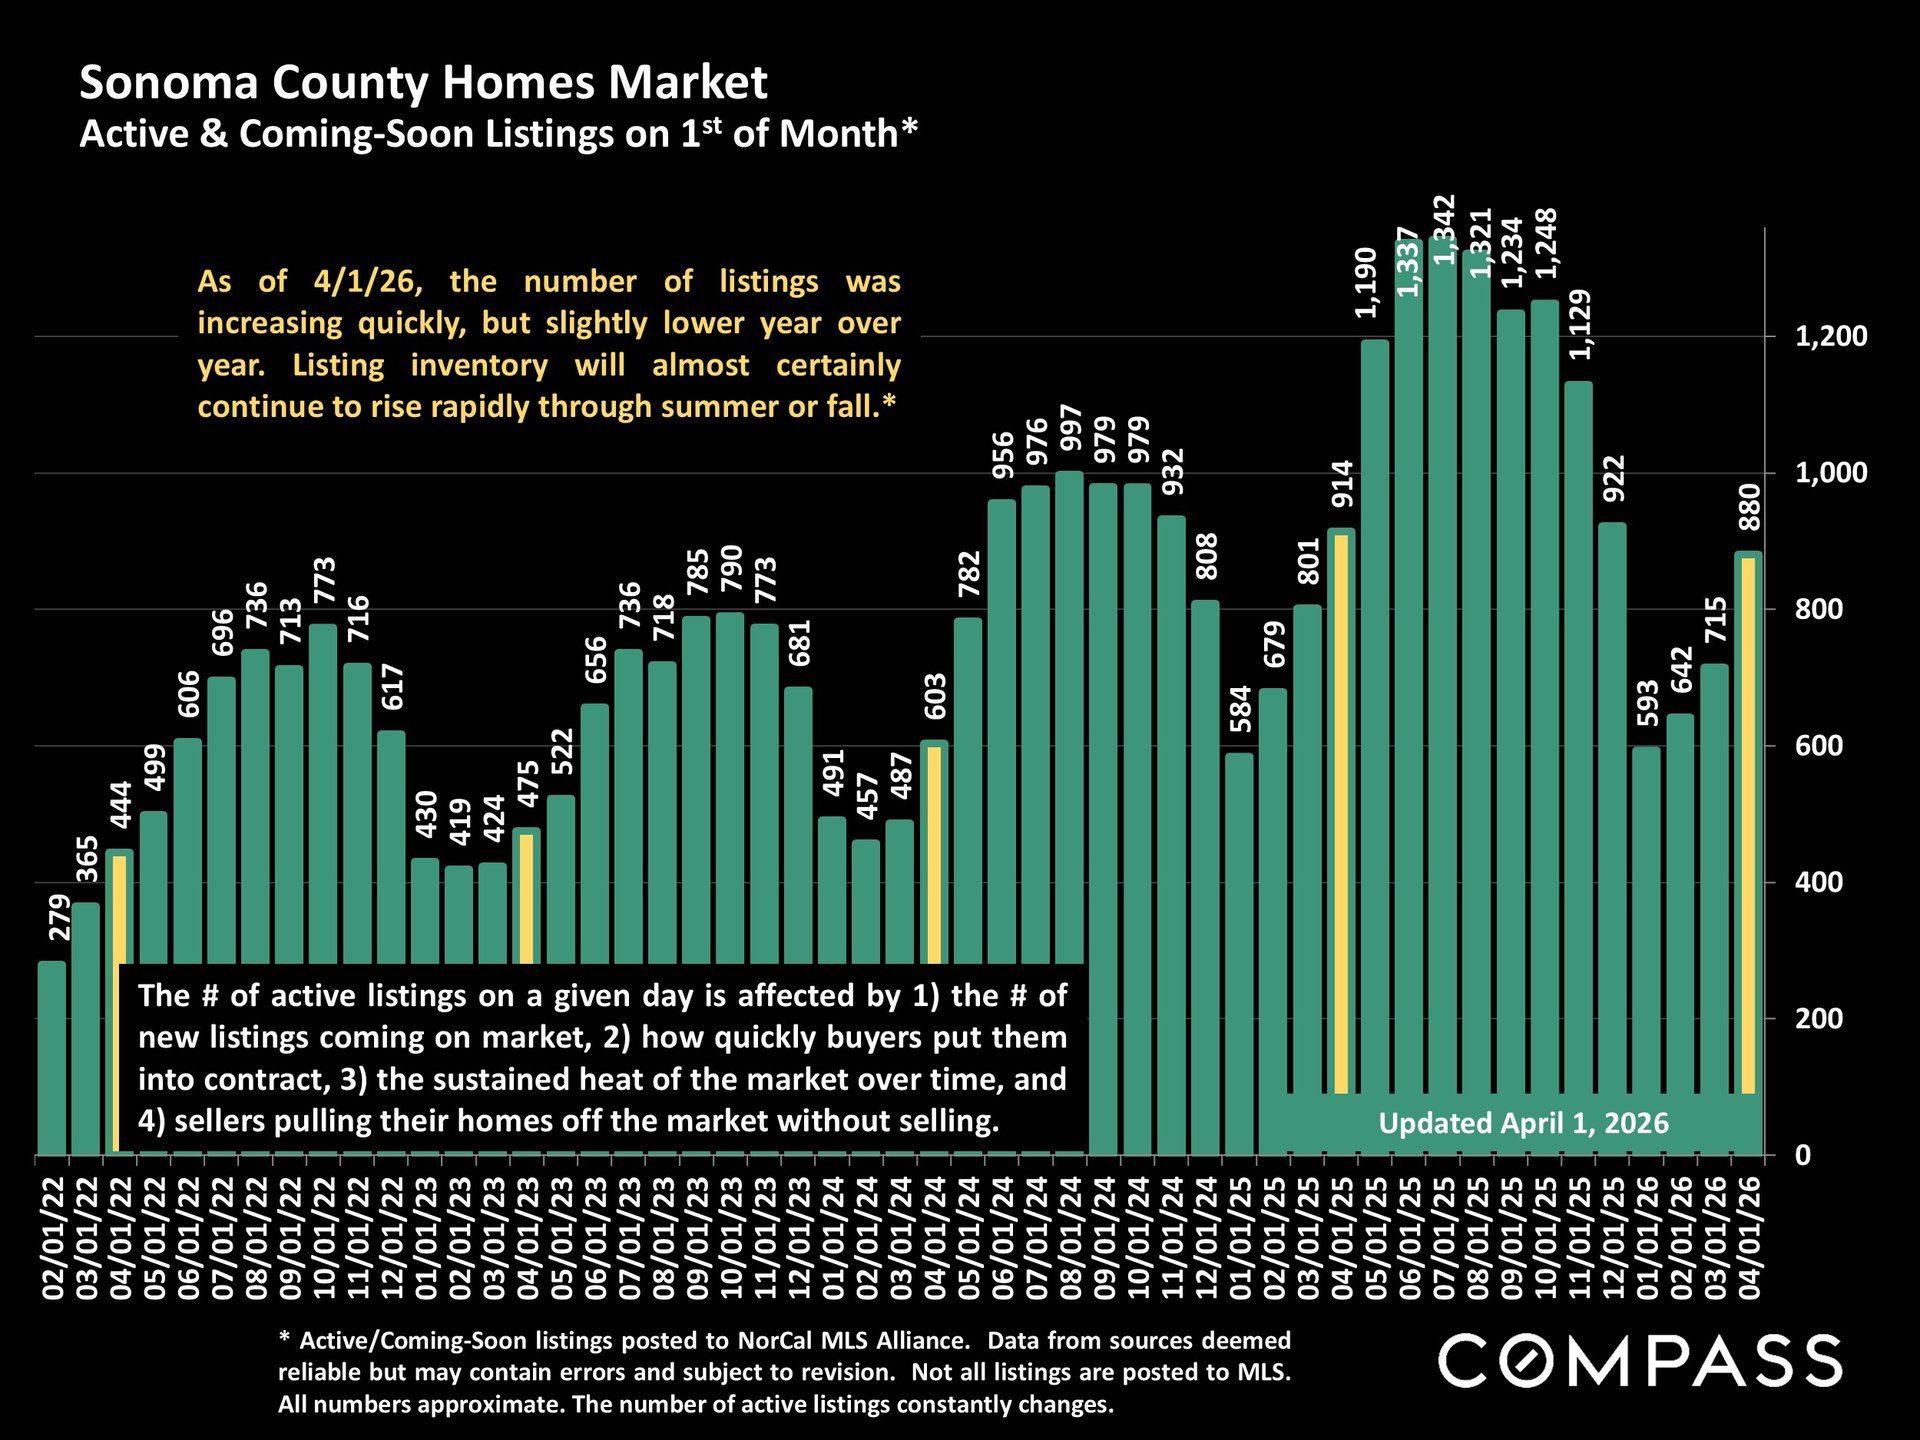
Supply options dramatically increased between March and April. Compared to the same period in 2025, the data is similar.
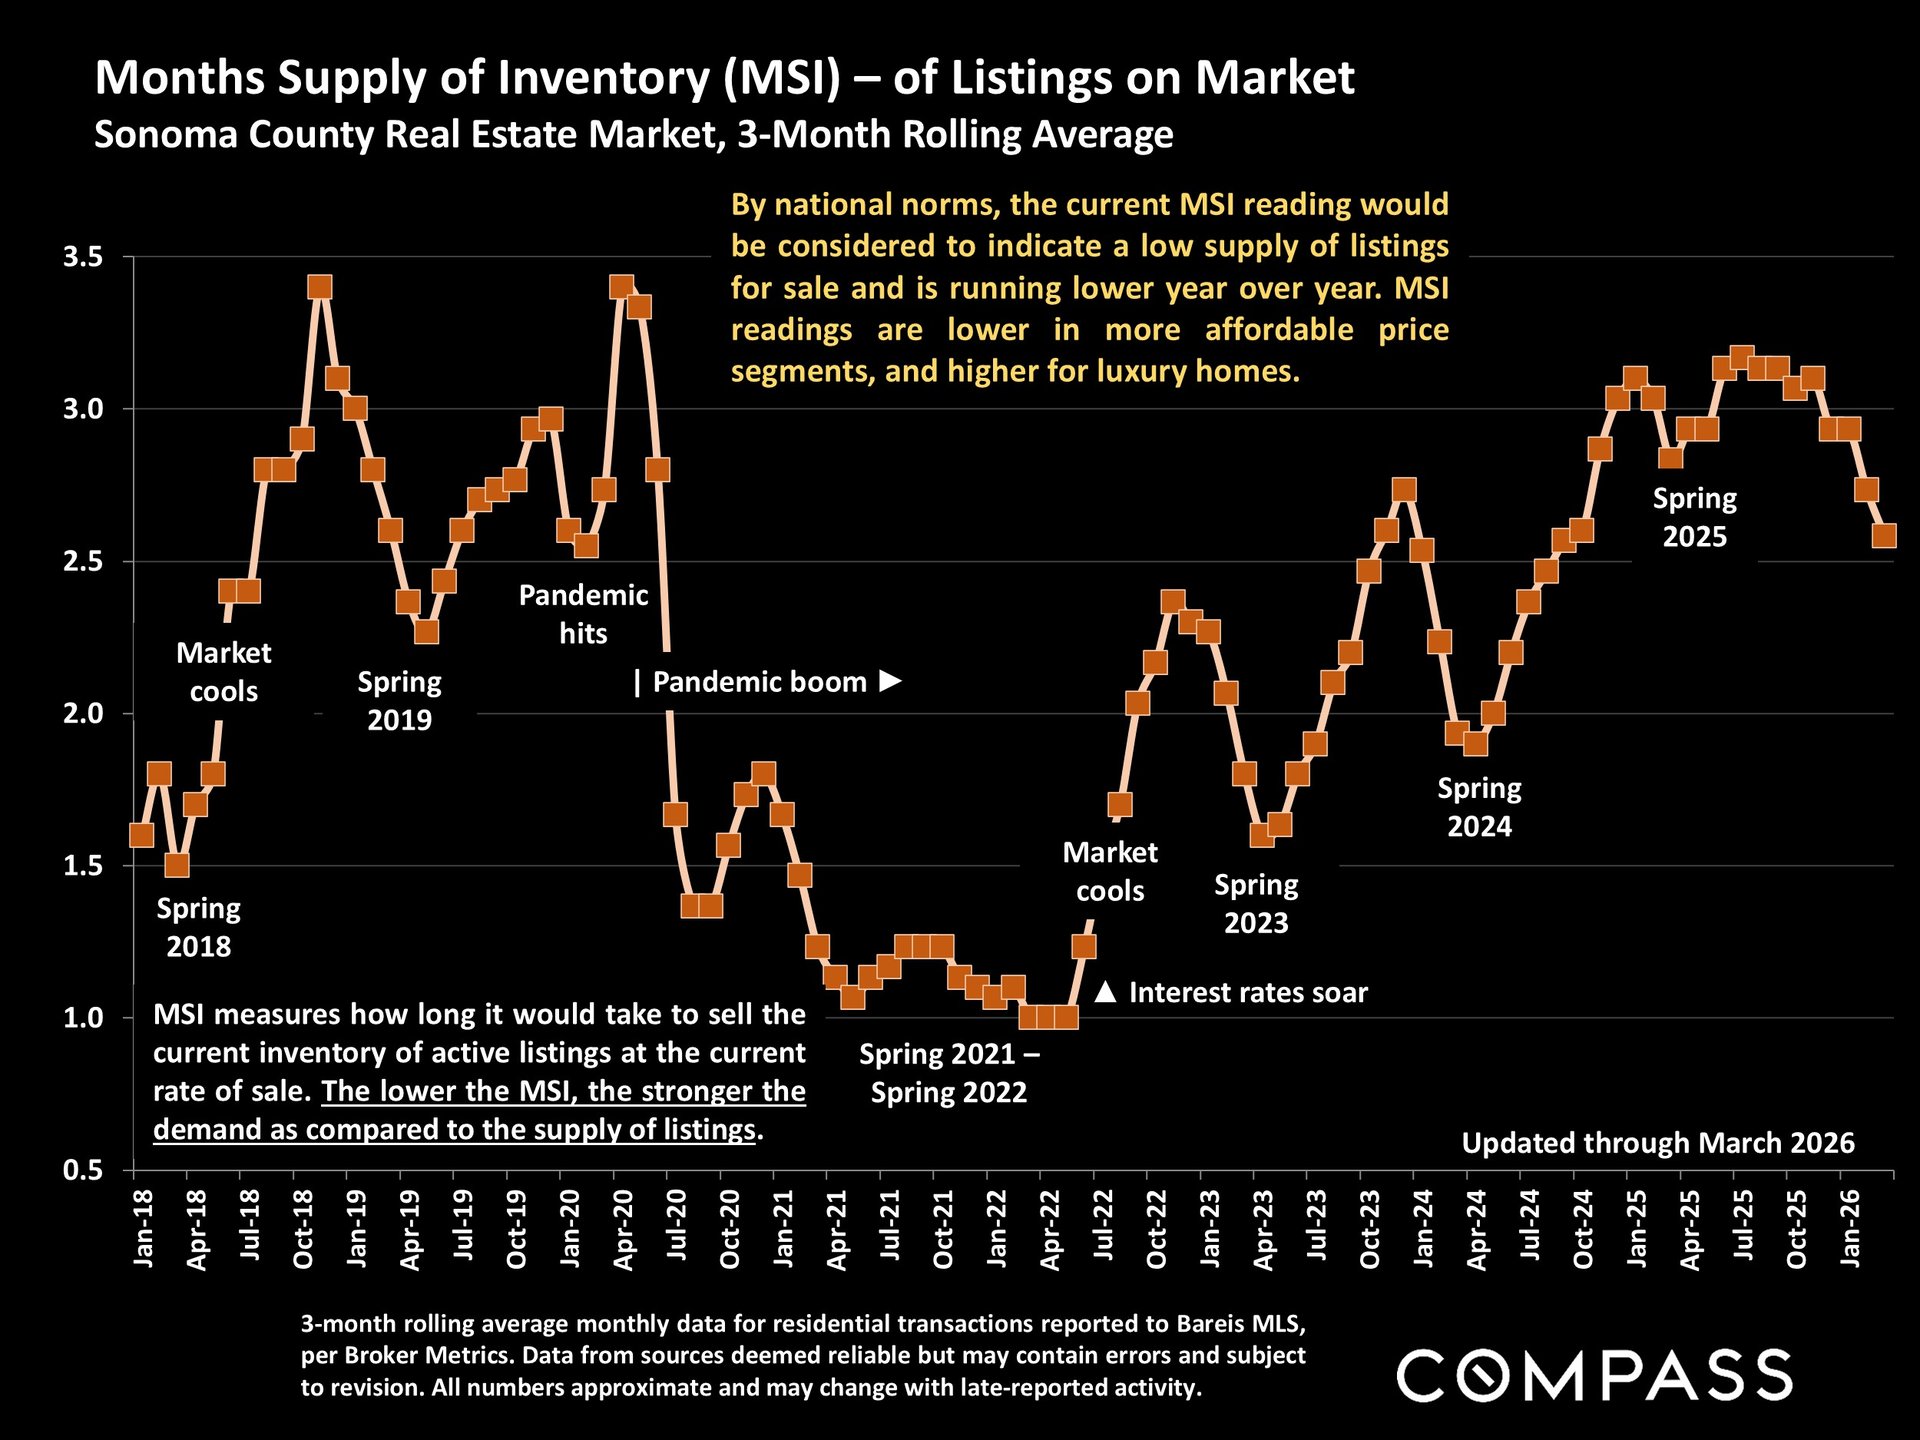
This 3-month average shows that between the fall of 2025 and the winter of 2026 buyers had fewer options to pick from. It will be important for us to revisit this figure when the next 3-month cycle is resolved for the start of 2026. We anticipate the latest supply spikes will bring the MSI up again.
When you drill down on specific neighborhoods, the above figure can vary. Yet these county wide trends have a solid influence and reflect real dynamics.
The education from last year's market pointed to the importance of sellers providing competitive prices when hitting the market. Buyers are expecting options and competition for their attention and dollars.
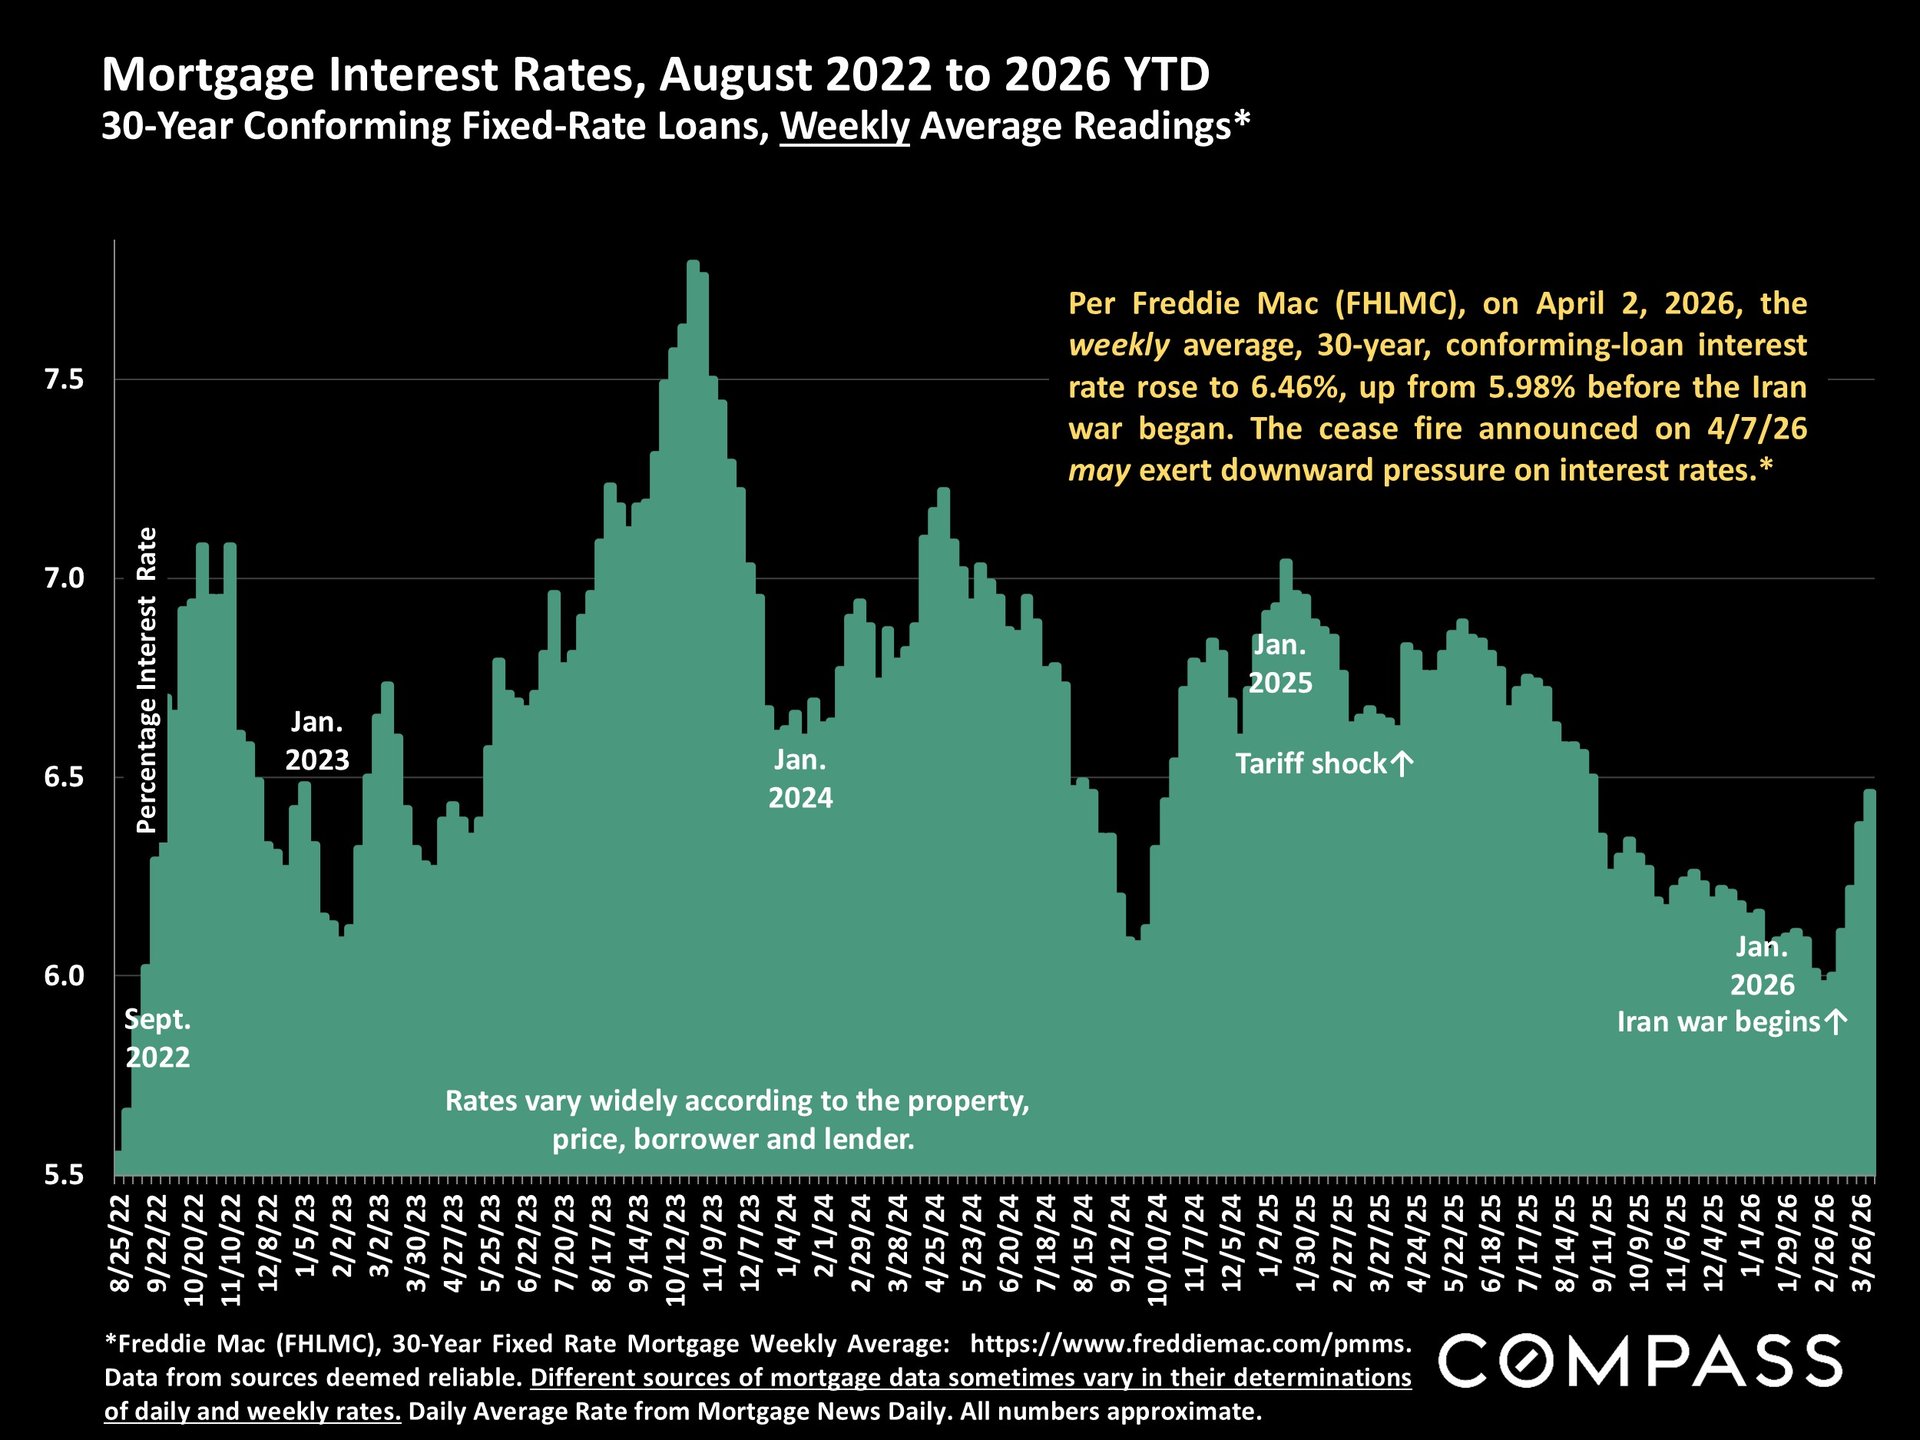
Most buyers ability in the market is downstream from interest rates. The start of 2026 saw great directional movement below the important 6.0% threshold for unlocking greater buyer demand. Greater buyer demand can lead to price increases through competition or multiple-offers.
However, recent shifts have lead interest rates back up. This opens up greater options for all-cash buyers. While some degree of leveraged buyers may choose to wait out the storm for lower future options.