
National Trends & Data
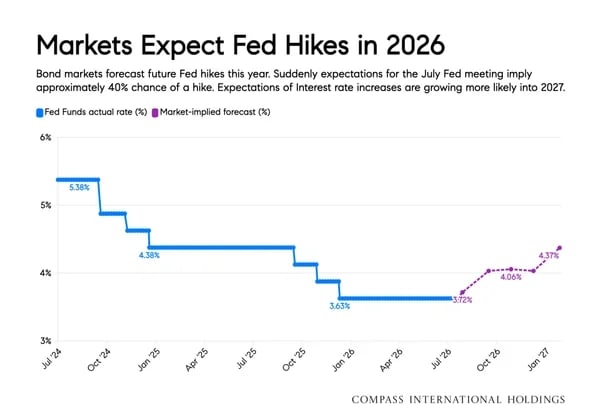
Our Perspective -- The wave that can rock the boat in real estate markets is interest rates. The July Fed meeting voted to keep rates in place. Now the view turns to the September meeting where, as NBC reports, "Fed funds futures are pricing in a roughly 82% likelihood that the central bank lifts borrowing costs at its September policy meeting, according to CME’s FedWatch tool. A week ago, those odds sat below 53%."
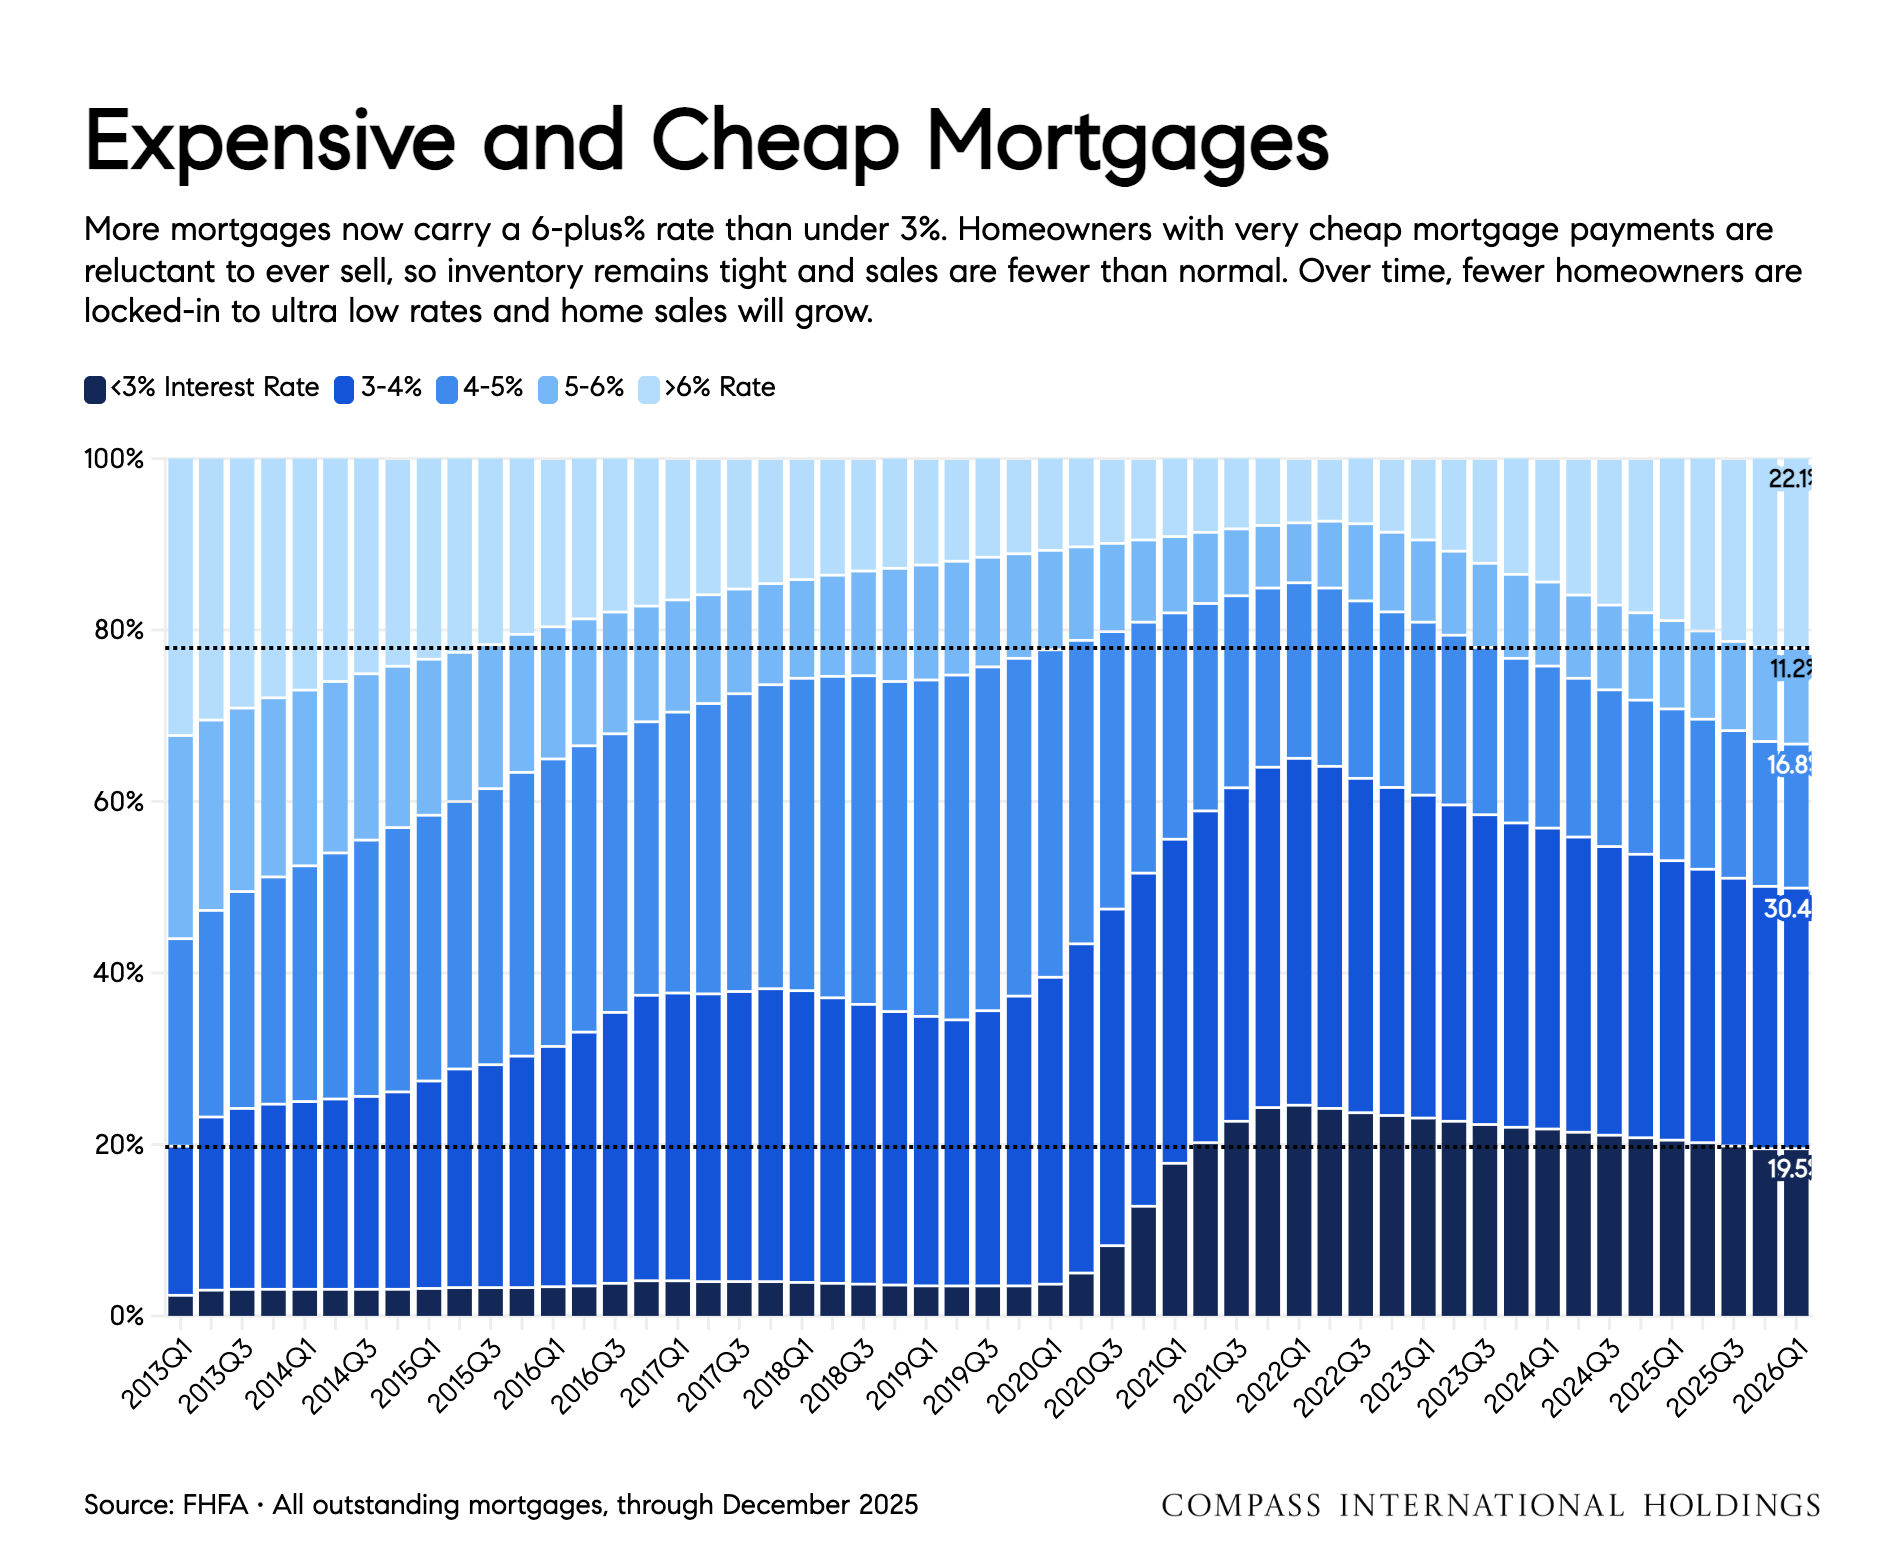
Our Perspective -- This is a fascinating chart showing the distribution of actualized interest rates for homeowners. Many want-to-be buyers have to weight the interest rate their leaving for the interest rate they'll walk into. This is impacting our "upgrade" buyers intra-county.
Sonoma County Trends & Data
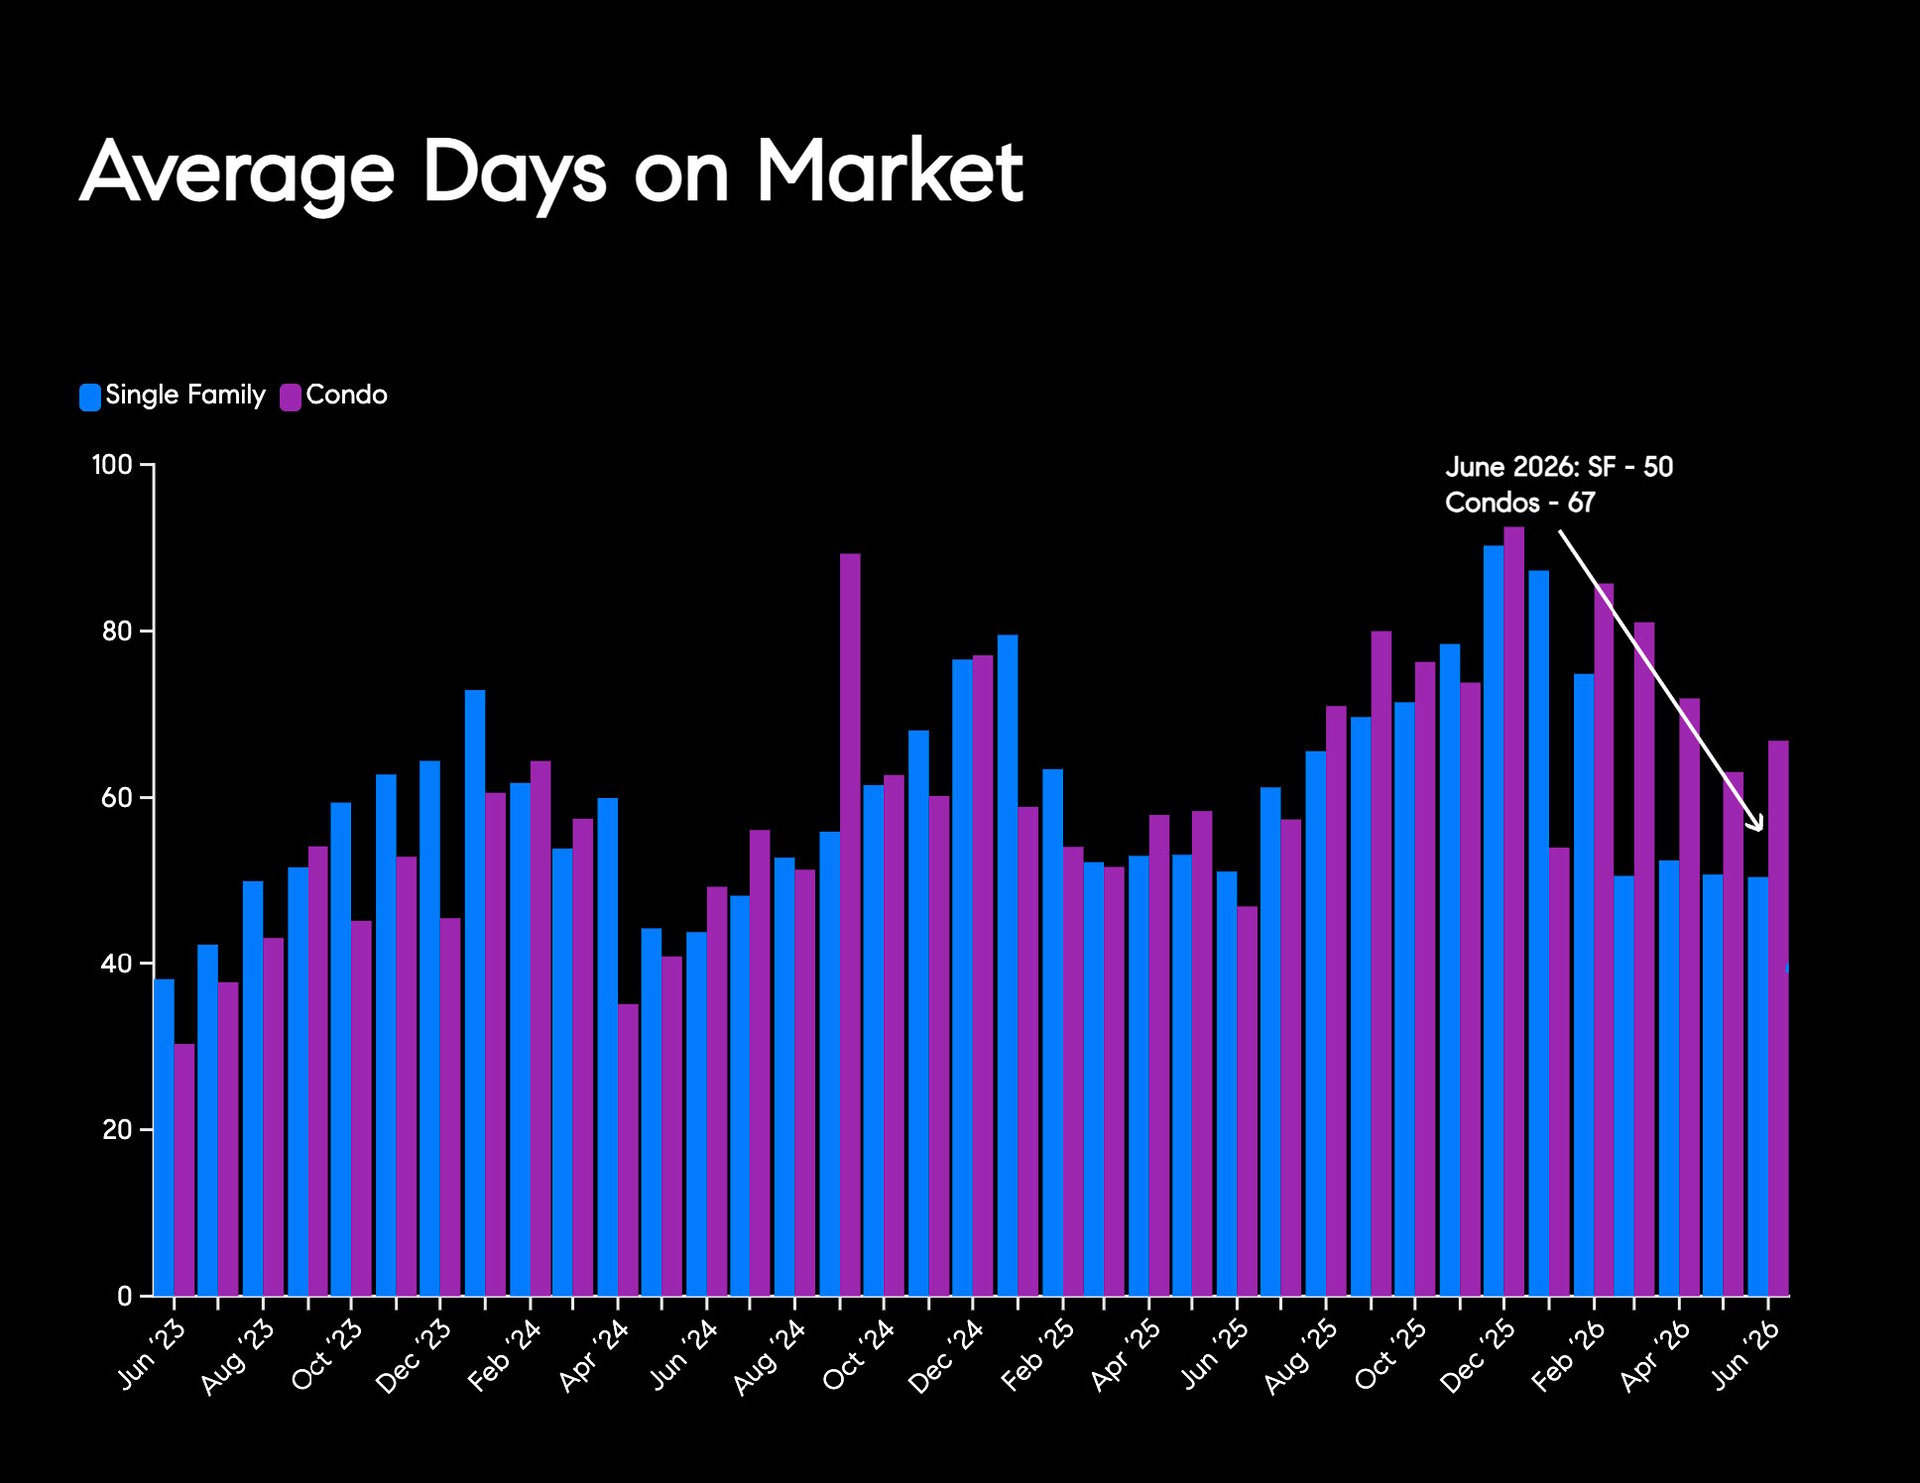
Our Perspective -- Sonoma County is a very market specific landscape. Areas with greater 2nd home buyers have shown more resilience to market conditions than traditional live-work neighborhoods. This year, at the county average, we're seeing the days on market figure bob around 50 days through out 2026.
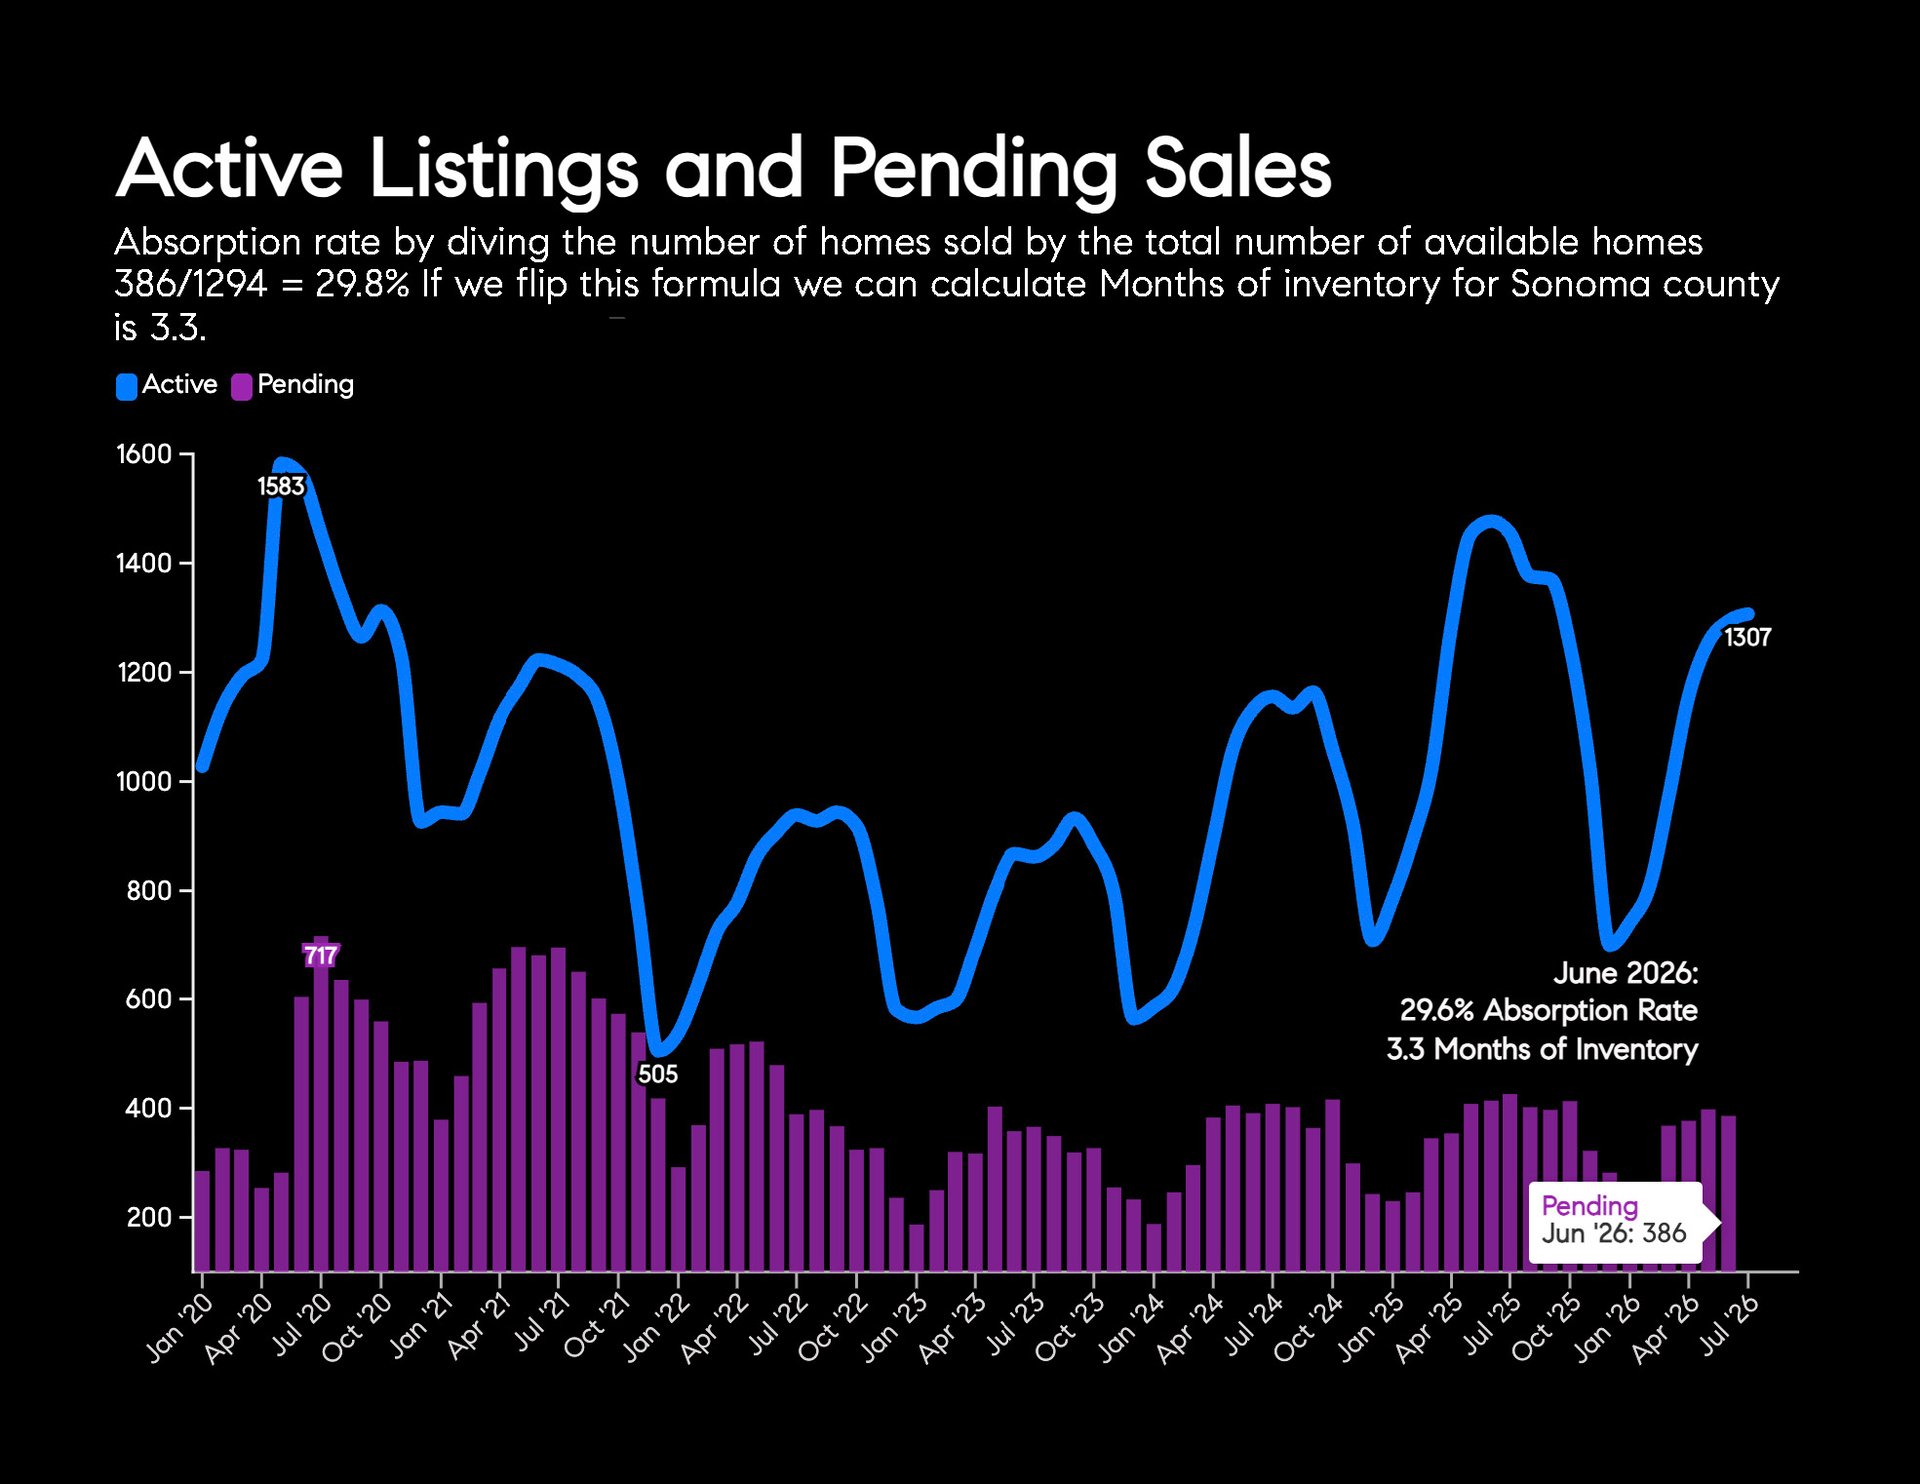
Our Perspective -- Sonoma County data is showing comparable supply and pending rates as to 2025 - a year where price sensitive buyers took their time. Similar dynamics hold true in 2026.