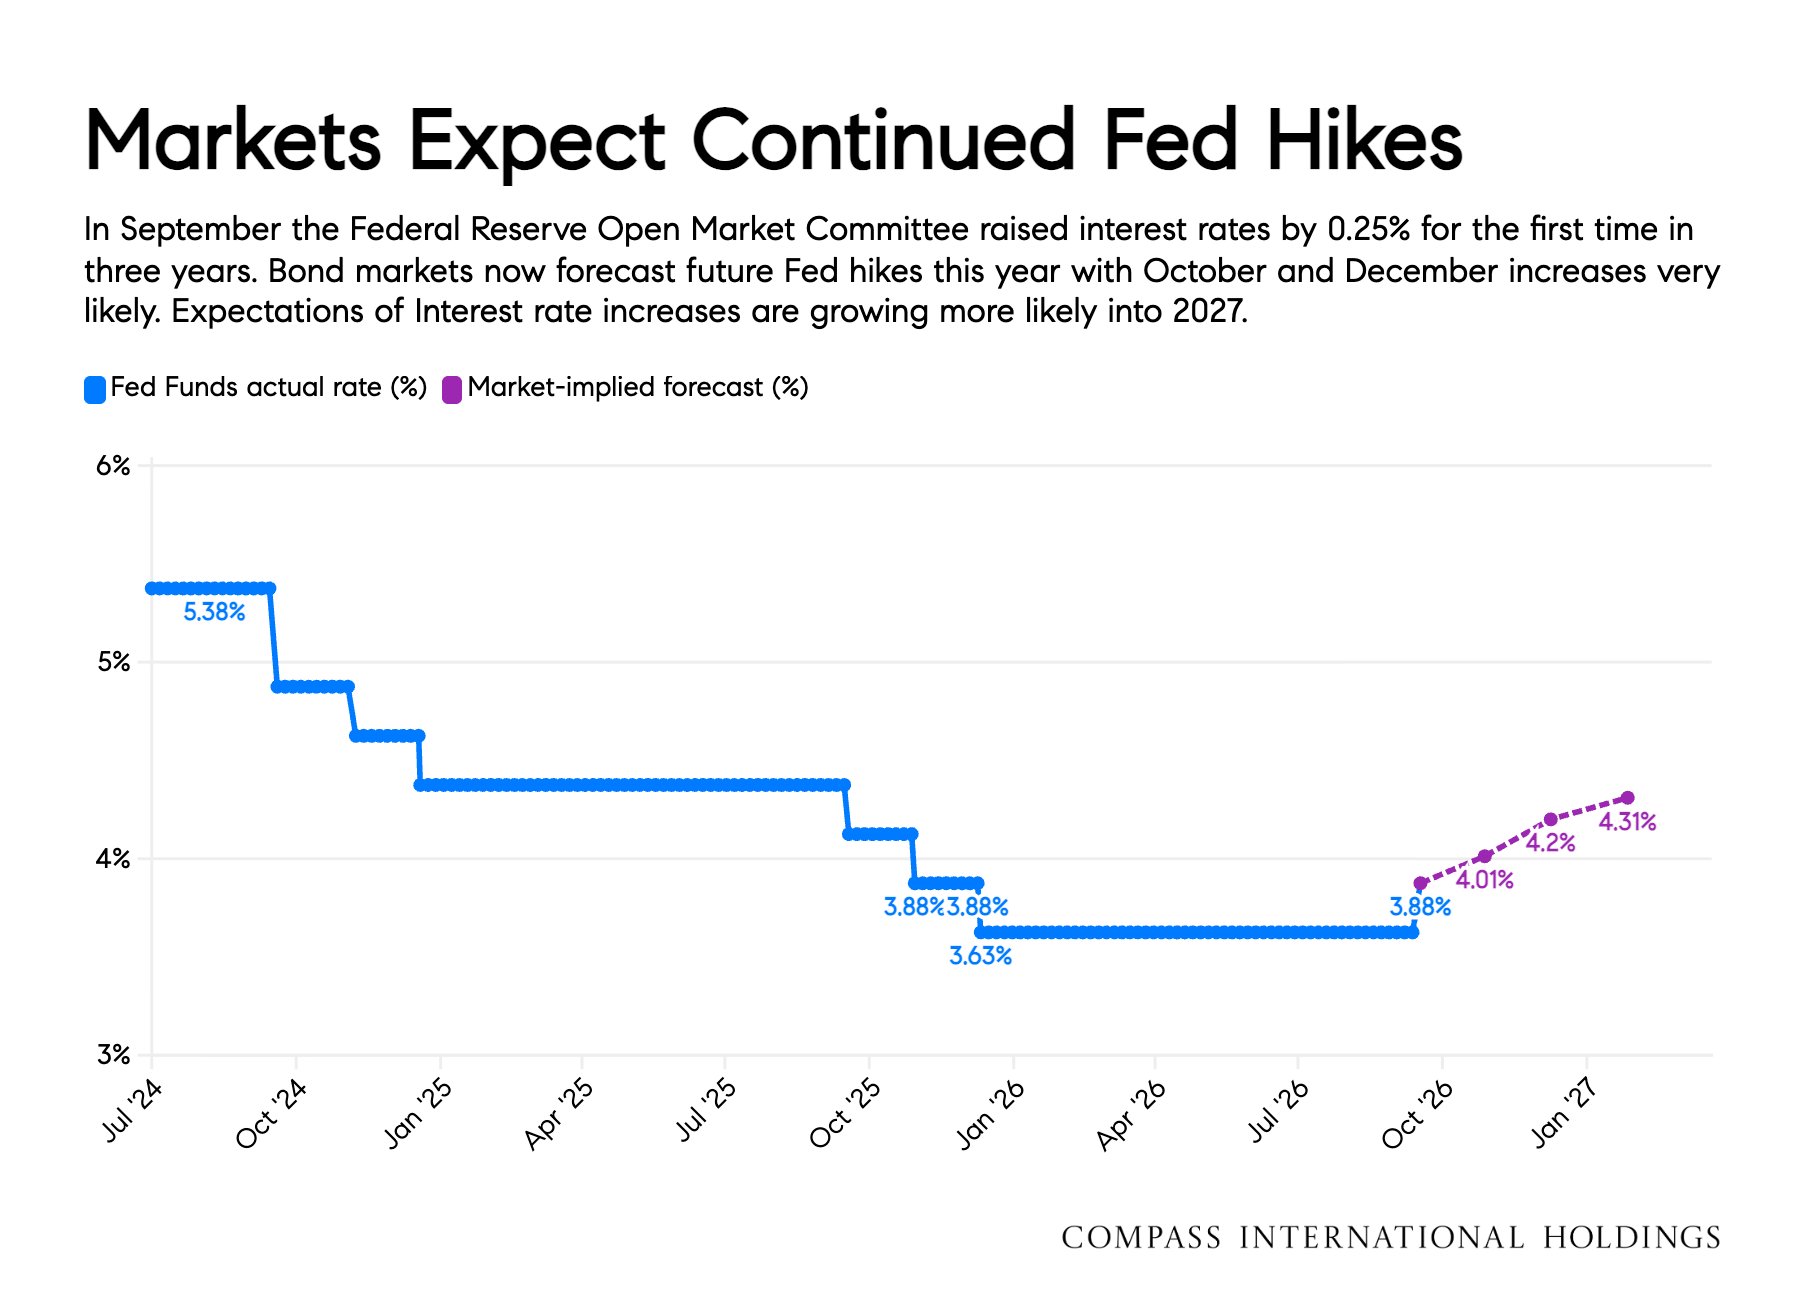
Our Perspective -- Recent Fed rate increases means the cost of cash is higher for the foreseeable future. What comes next is simply a guess. The predicted rate increases into 2027 would put greater pressure on buyers and can slow demand activity. On the other hand, geopolitical and trade dynamics can shift rather quickly. What comes next will be a mix of market and political winds coming together.
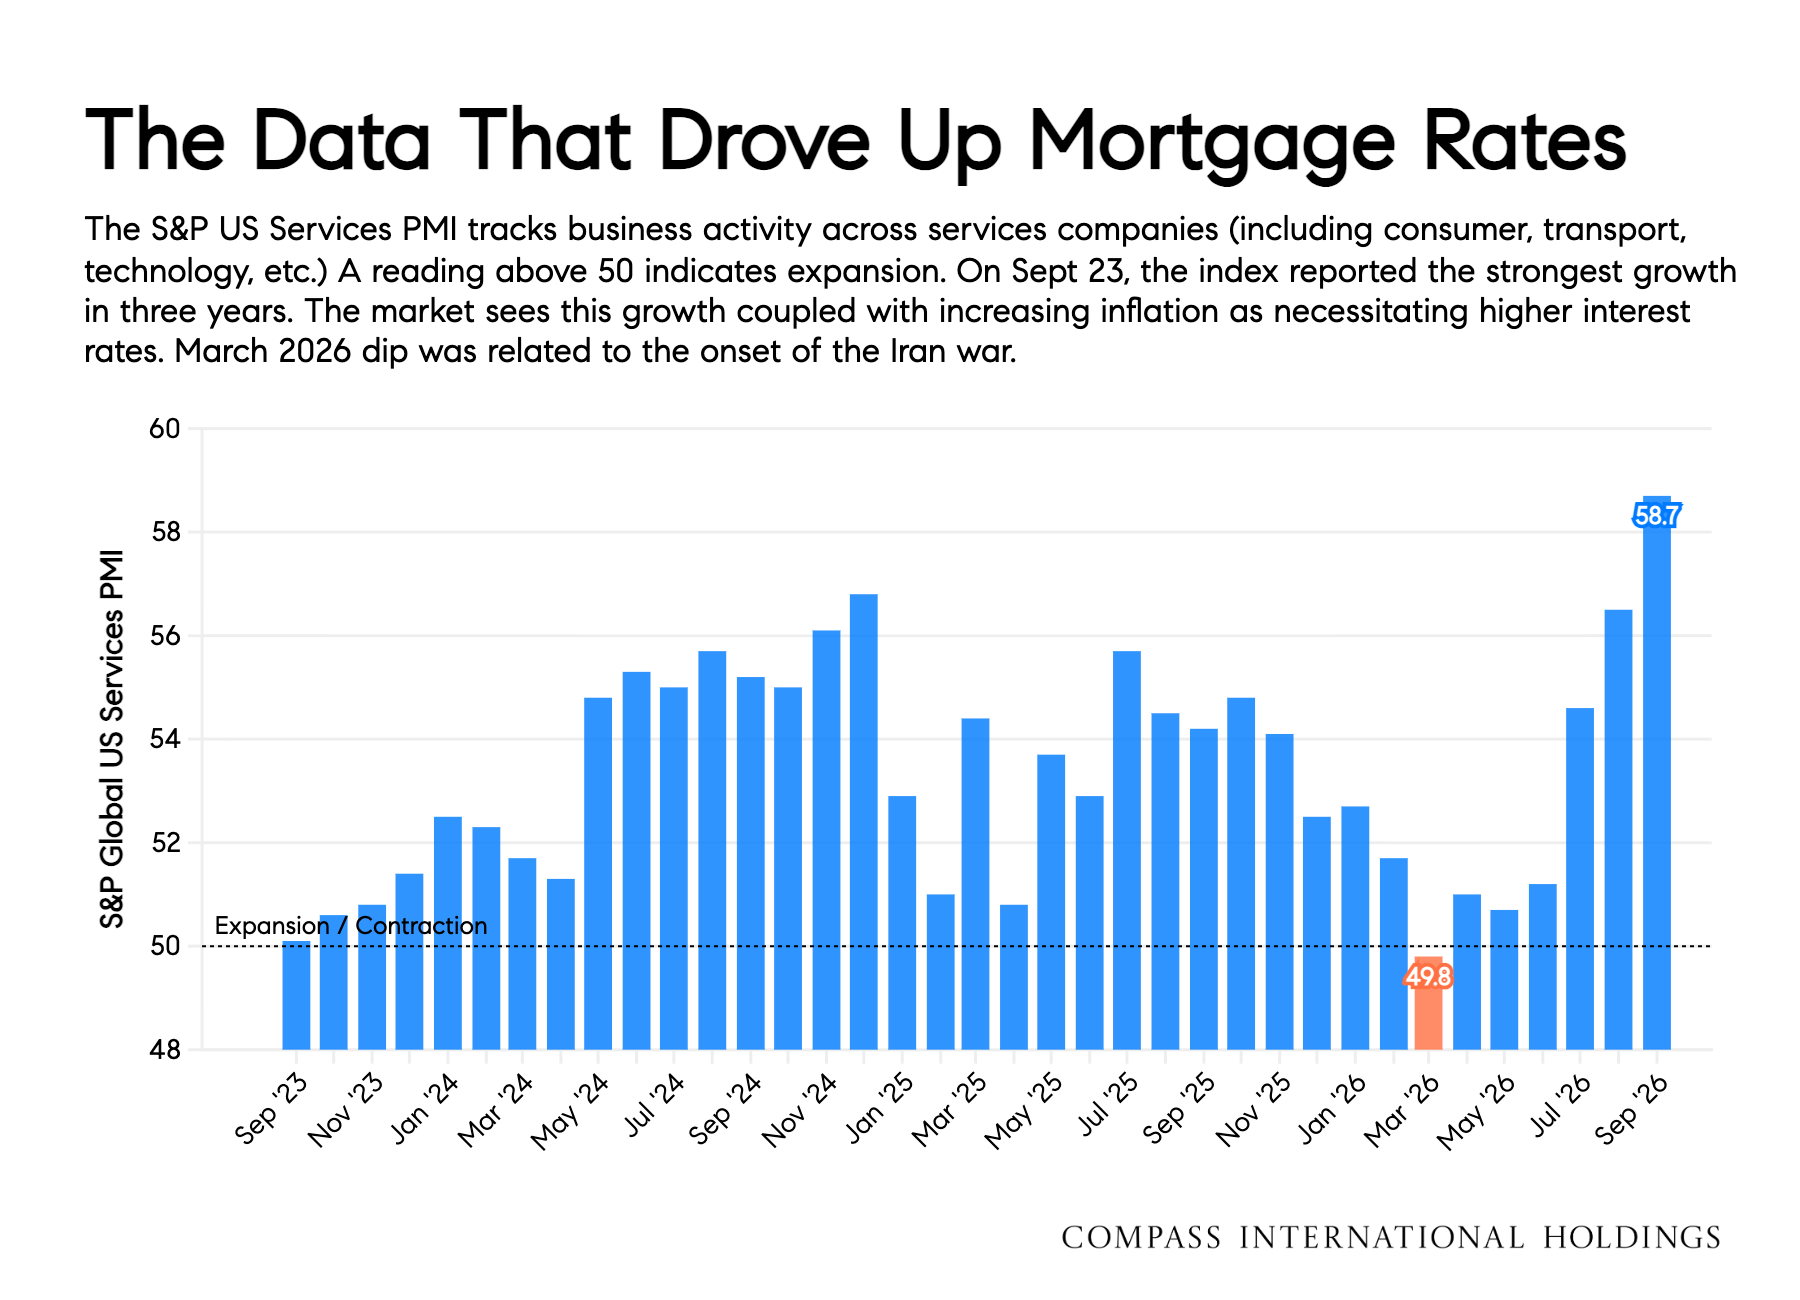
Our Perspective -- A growing business sector coupled with increasing prices has pushed the Fed to raise rates. For context, this is "the fastest expansion since July 2021... Growth was driven by the service sector, which reported the steepest rise in output for over five years, but a welcome development in September was an accompanying acceleration of manufacturing output growth to the fastest since April 2022." [You can find more here.]
When rates go up it's important to remember, it's not always for bad reasons. If the rates were solely pushed due to price increases that would feel much worse than what we see here -- services sector and manufacturing growth. With services being our largest domestic job market.
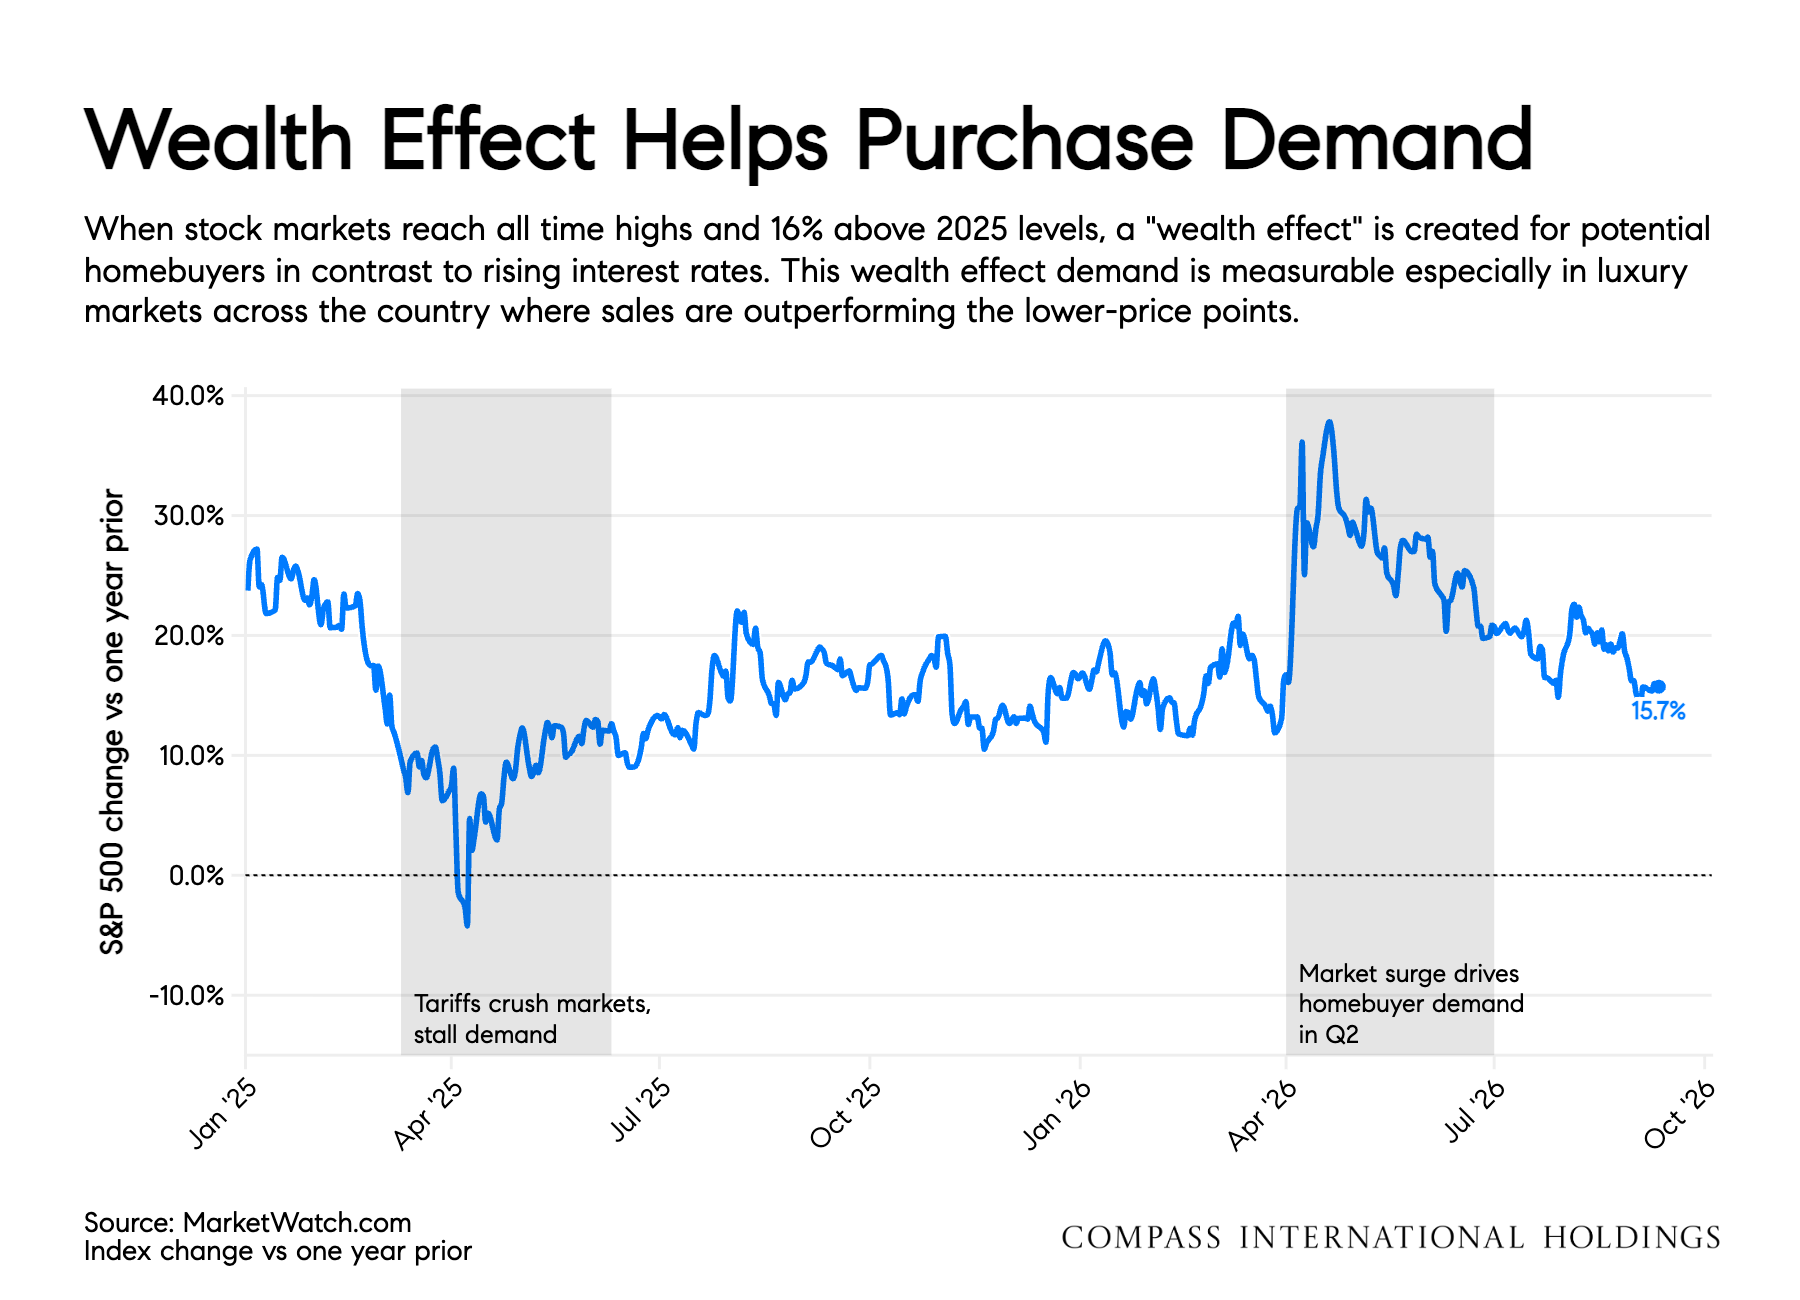
Our Perspective -- The direct Bay Area's real estate market has rallied this past year - especially around San Francisco, which had struggled since 2020. A tech boom stemming from AI and stock market rallies gave high-end buyers more cash to purchase.
We anticipate a degree of indirect impact in the Sonoma County market as folks do a cost arbitrage to get away from booming housing prices. Sonoma County offers lower costs of living while maintaining a similar lifestyle. We've seen some of this already from buyers early in retirement who are charting their next chapter and see Sonoma County as a beautiful offering.
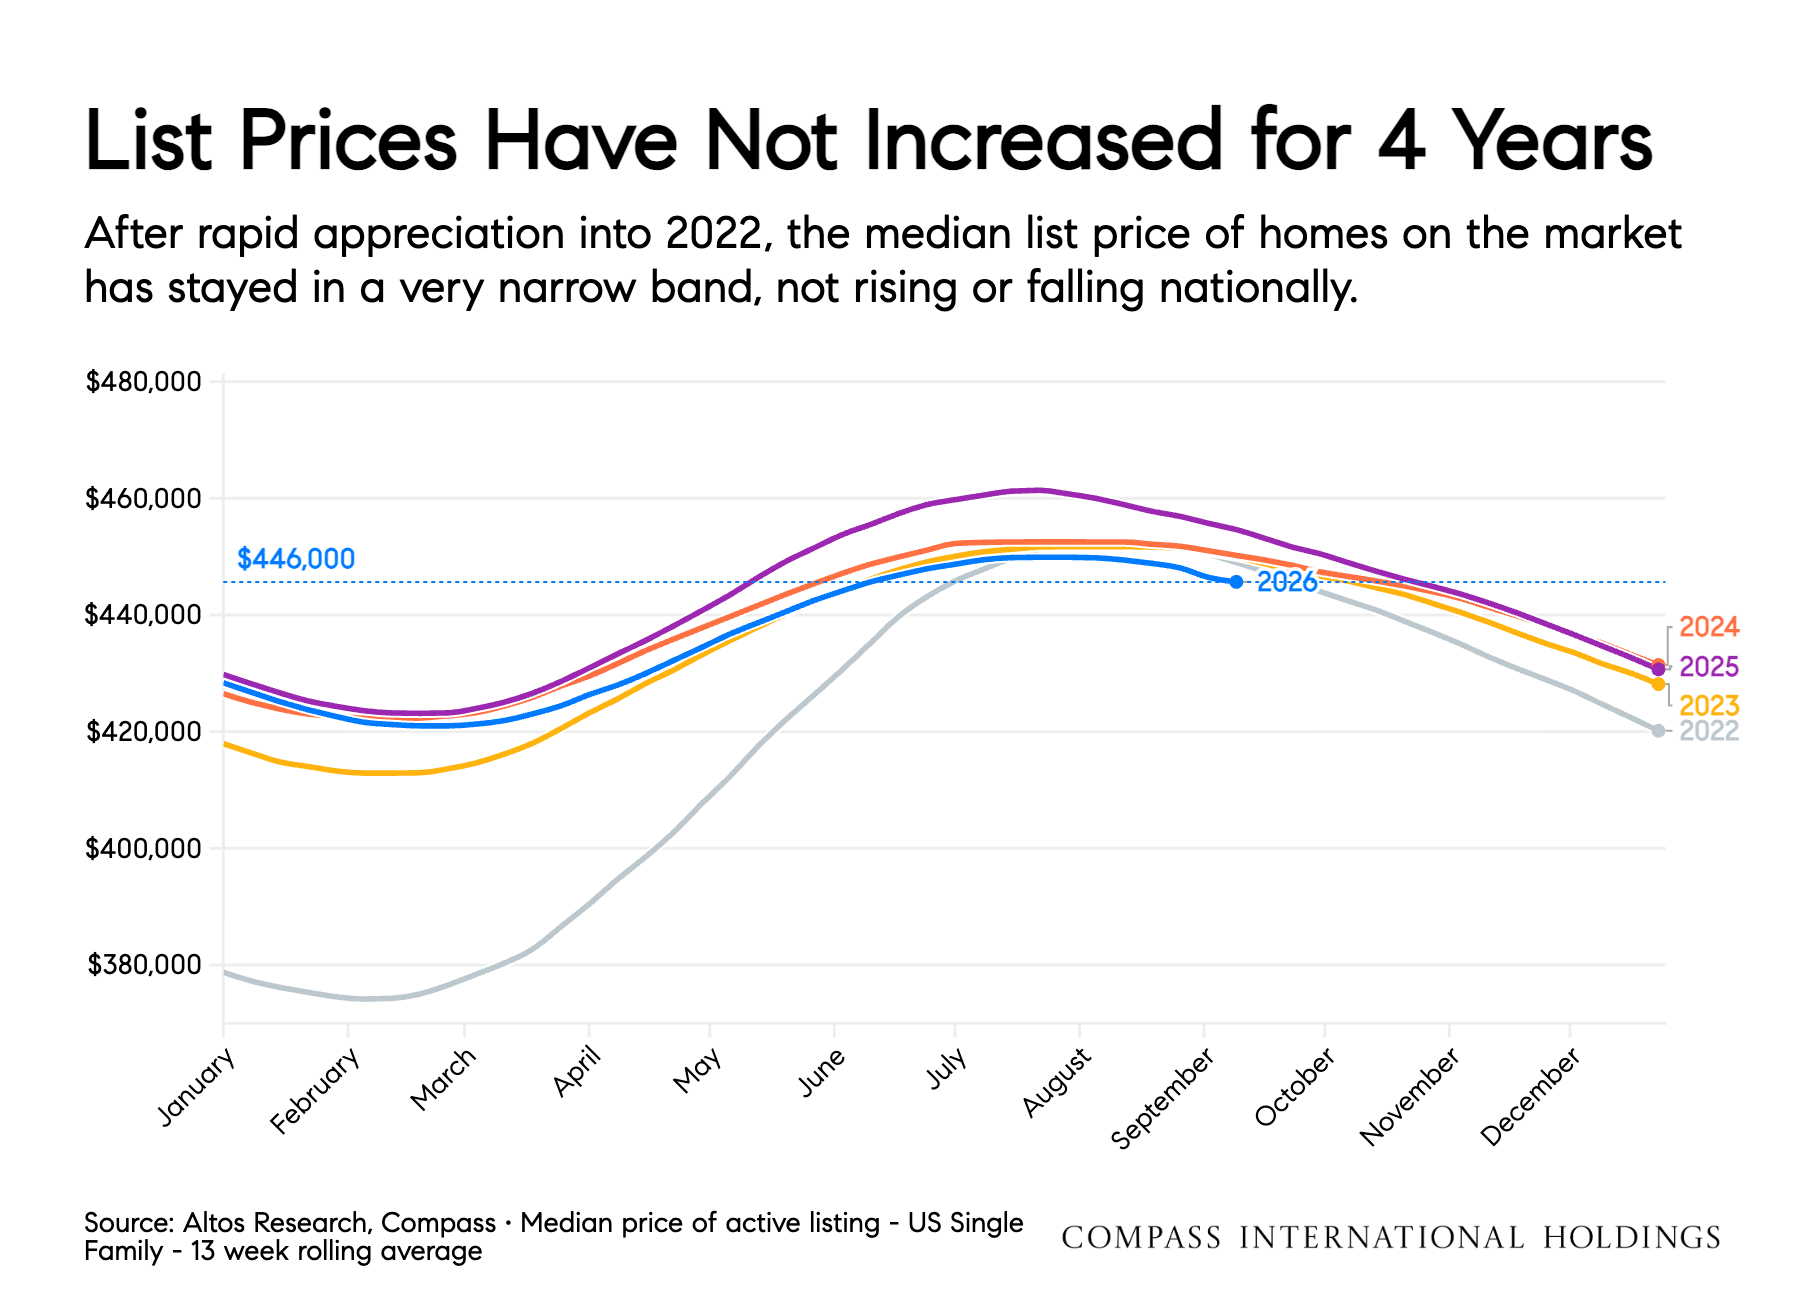
Our Perspective -- This national trend echos what we've seen locally for the past few years. We're all a part of the same stream in a way. Remember the above chart represents national figures.
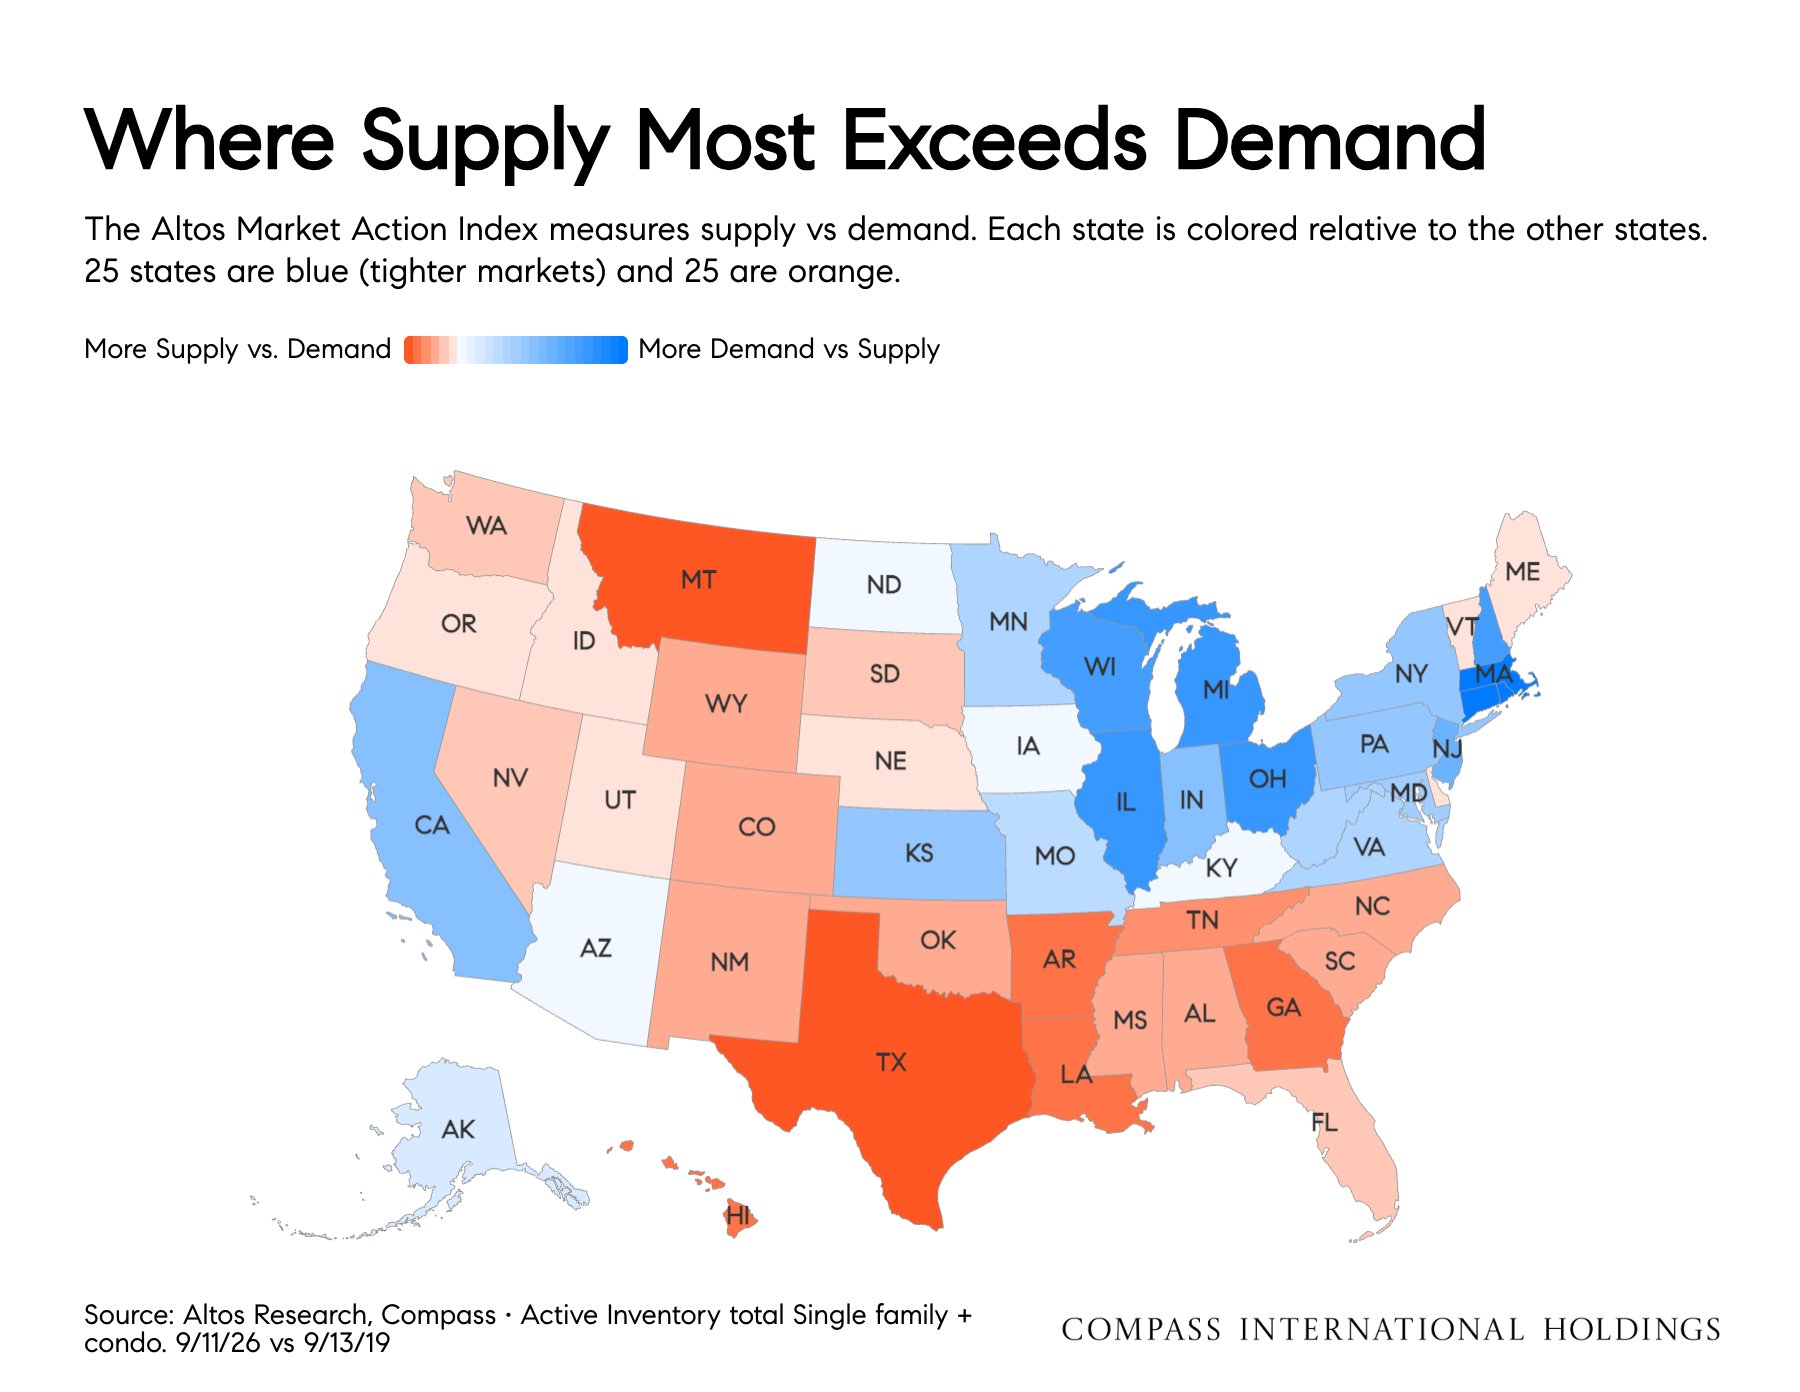
Our Perspective -- At the state-to-state level you can see how things have shifted - Texas is experiencing oversupply, other areas of the sun-belt have cooled, and the midwest show resilience... Considering the counts, look at this map as the demand in and around cities for each state, as that's represents the largest piece of the pie for housing inventory.