
January marks the fresh start of the year, with new listings arriving in the latter part of the month. It's a time of low inventory with a hint of where Spring is headed. What we expect: re-lists of homes that did not sell last year and a continuation of two different markets: those that price attractively and those priced too high. We've got a lot to share with you this month!
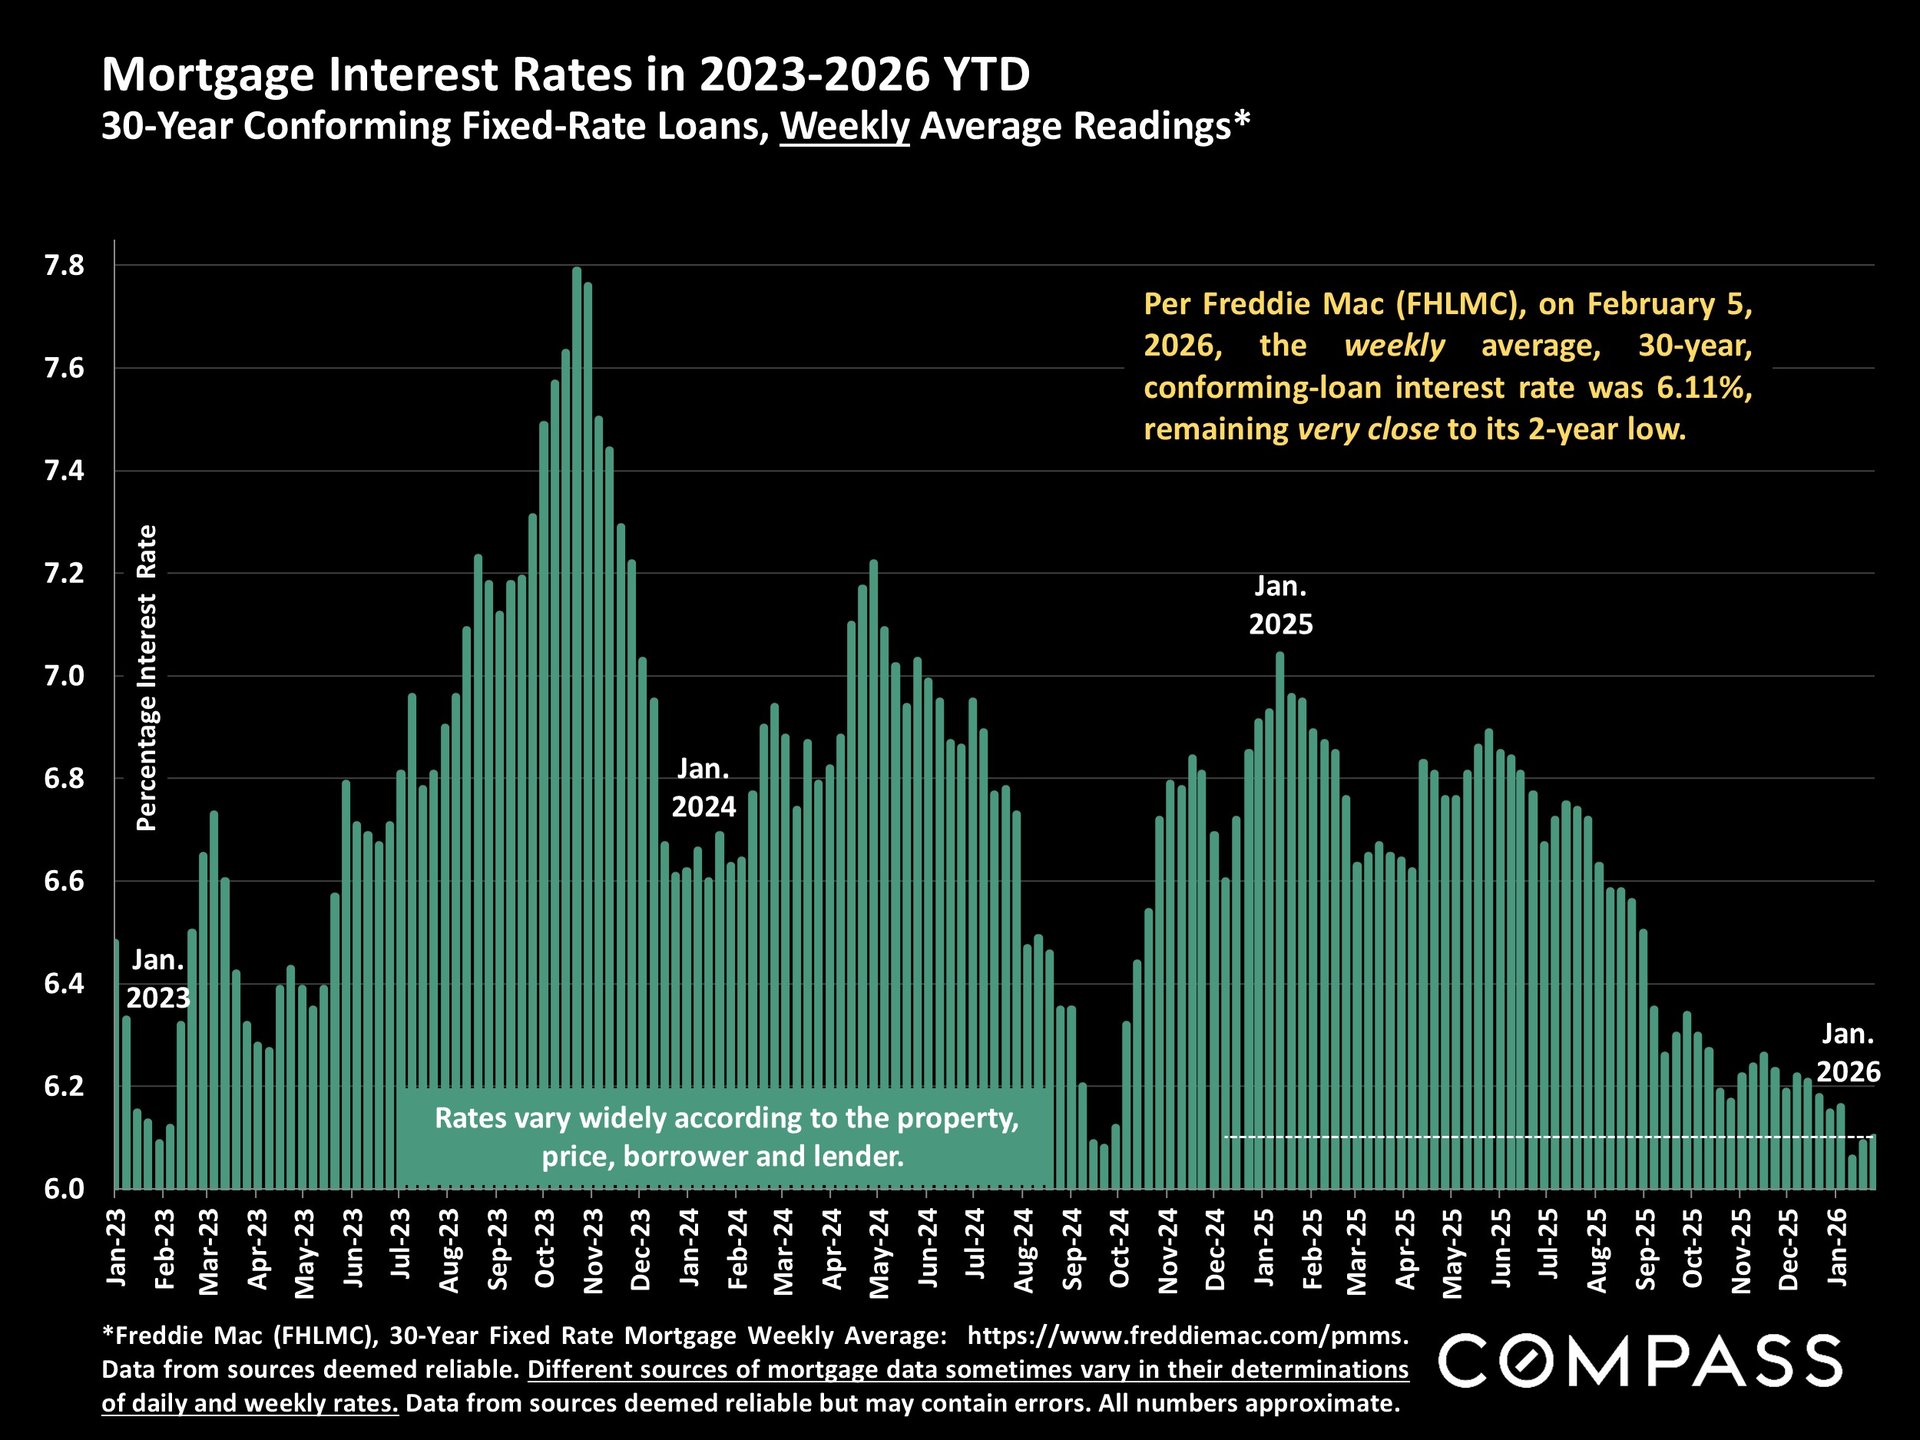
We recently had clients who secured a great rate in the high 5s! Our title partners tell us that refinances are picking up as buyers who purchased at high rates over the past 2 years trade into lower rates.
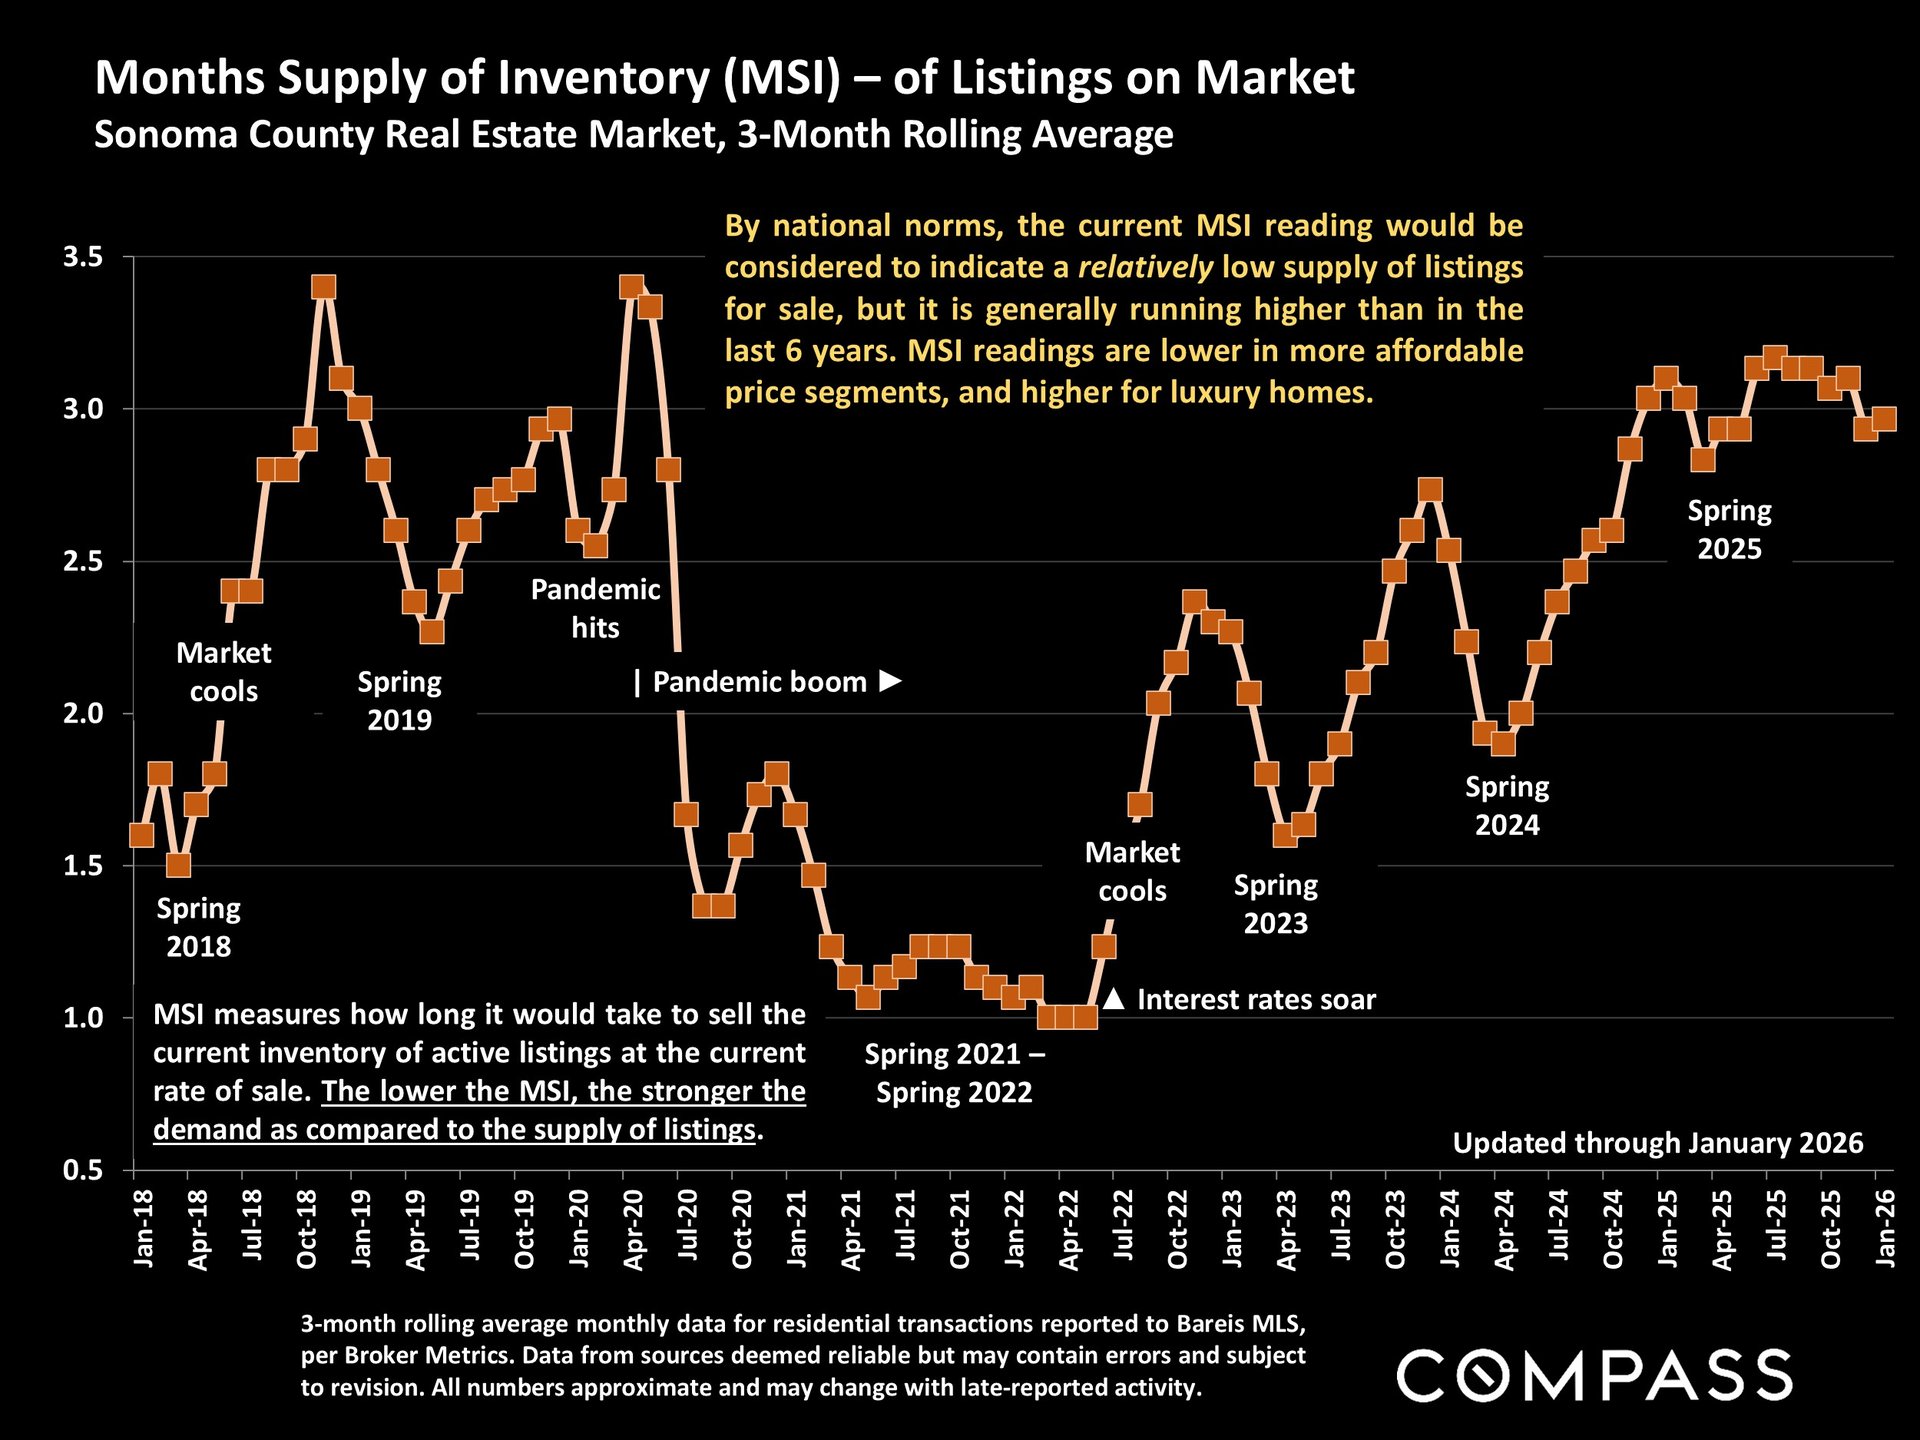
Although the market is seasonally lower as expected, this graph is telling! It shows that we still have more inventory than we had over the past few years. This creates buyer opportunity and pressure on sellers to price realistically and attractively. Additionally, in Sonoma County, there is almost 10% more inventory available through Compass Private Exclusive and Coming Soon. These are pre-MLS listings where sellers are often willing to sell off market as they wait for the garden to come into bloom, the rains to subside, and the market to heat up. But why wait? So far - we see that our January listings have done well.
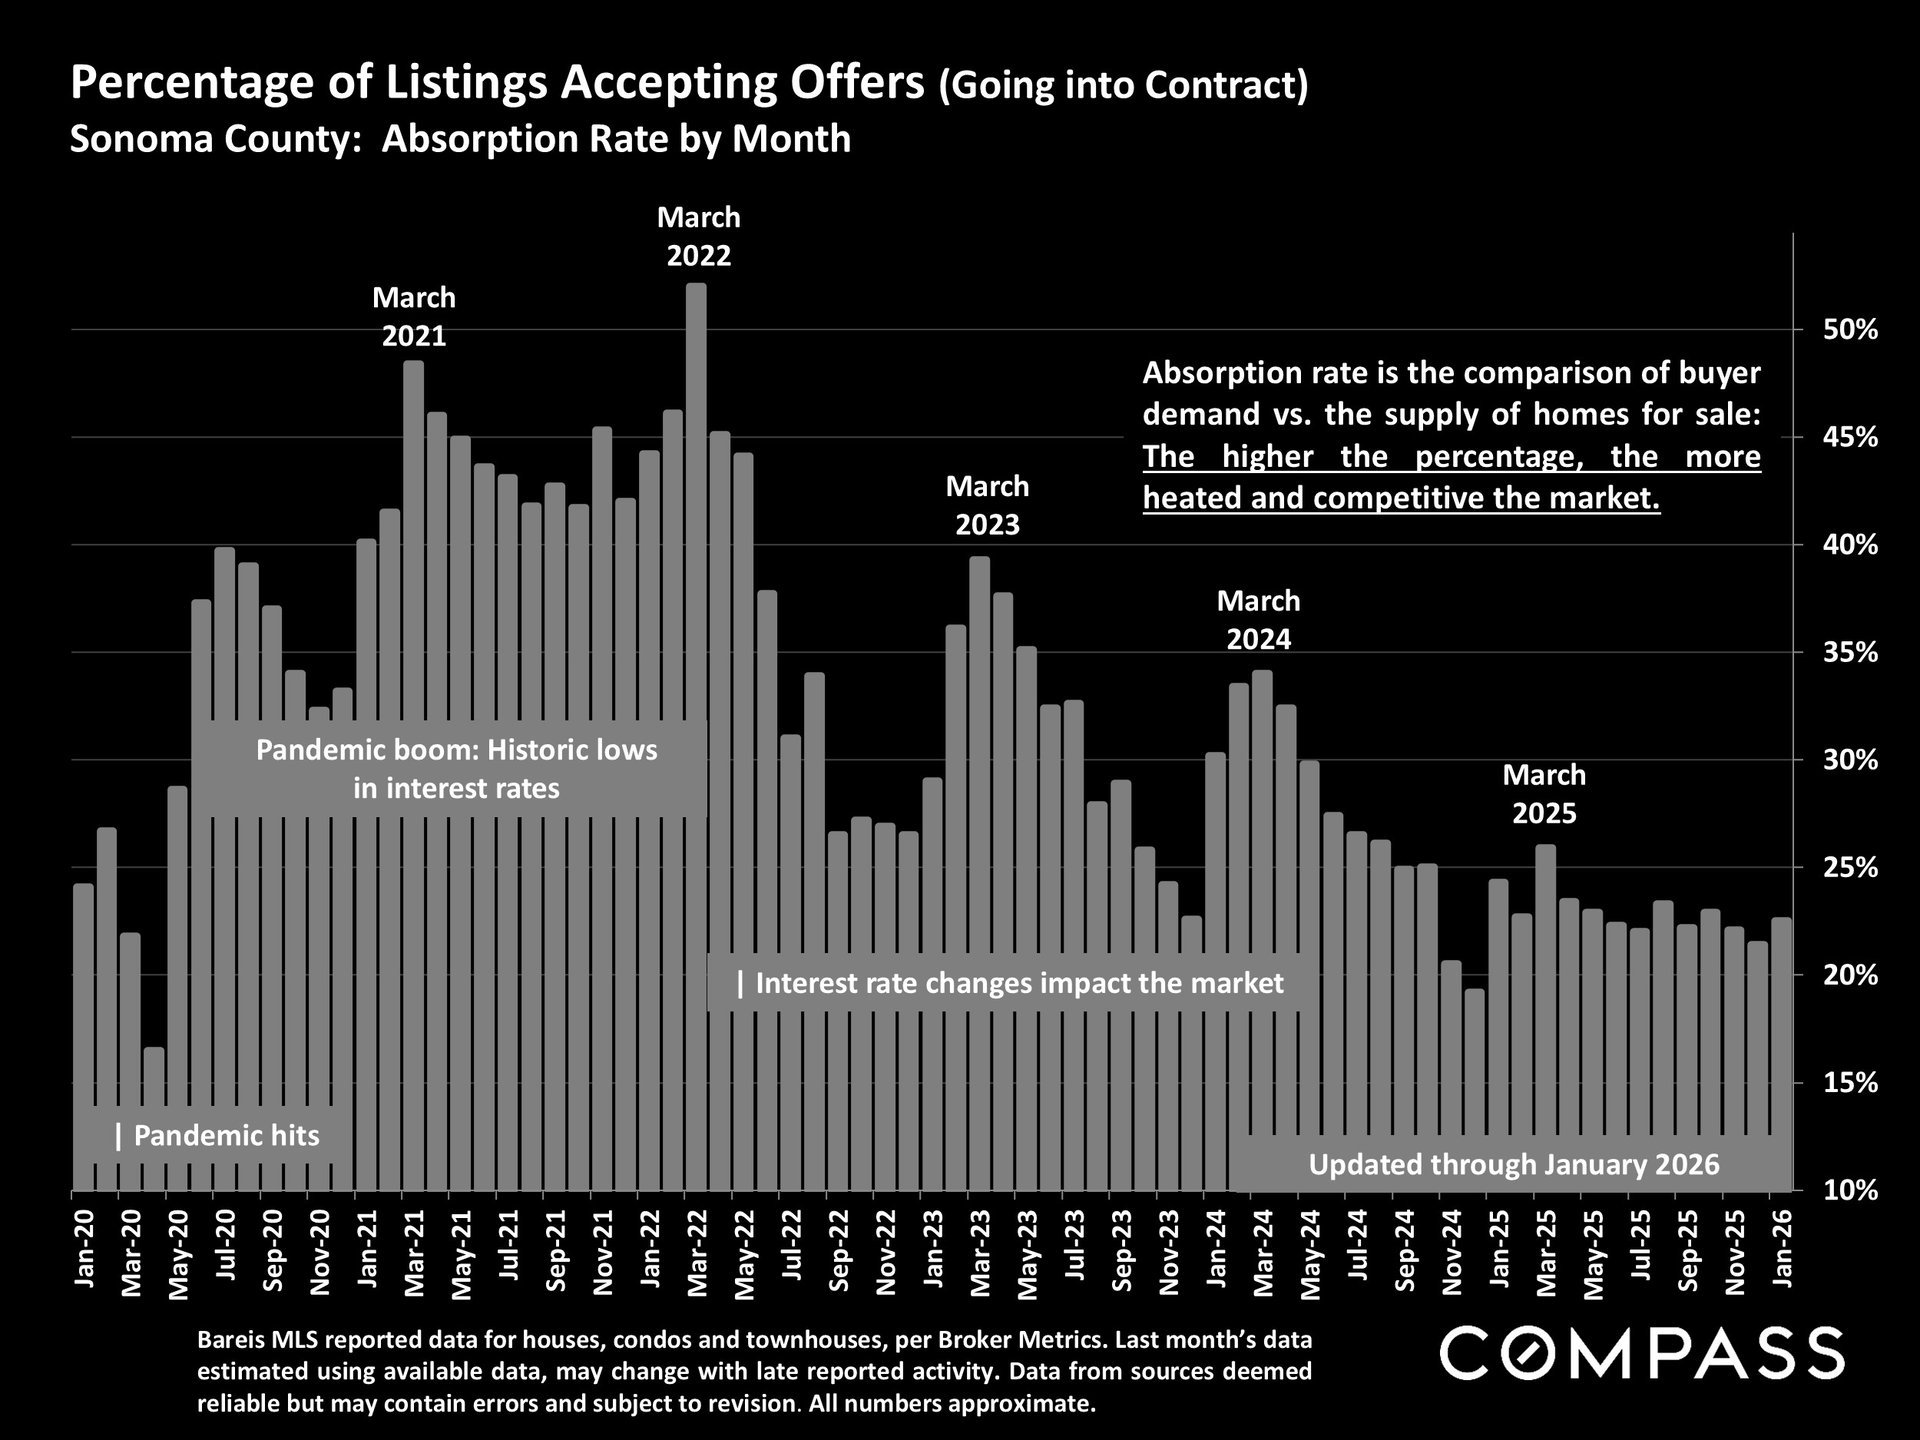
Since last year, we have seen the percentage of listings accepting offers bouncing around right under 25%. In the field, we see 2 paths: sellers that price right from the gate and go into contract quickly, and those that have priced too high and have to wait. We expect this number to increase in February based on what it seems like in the field....
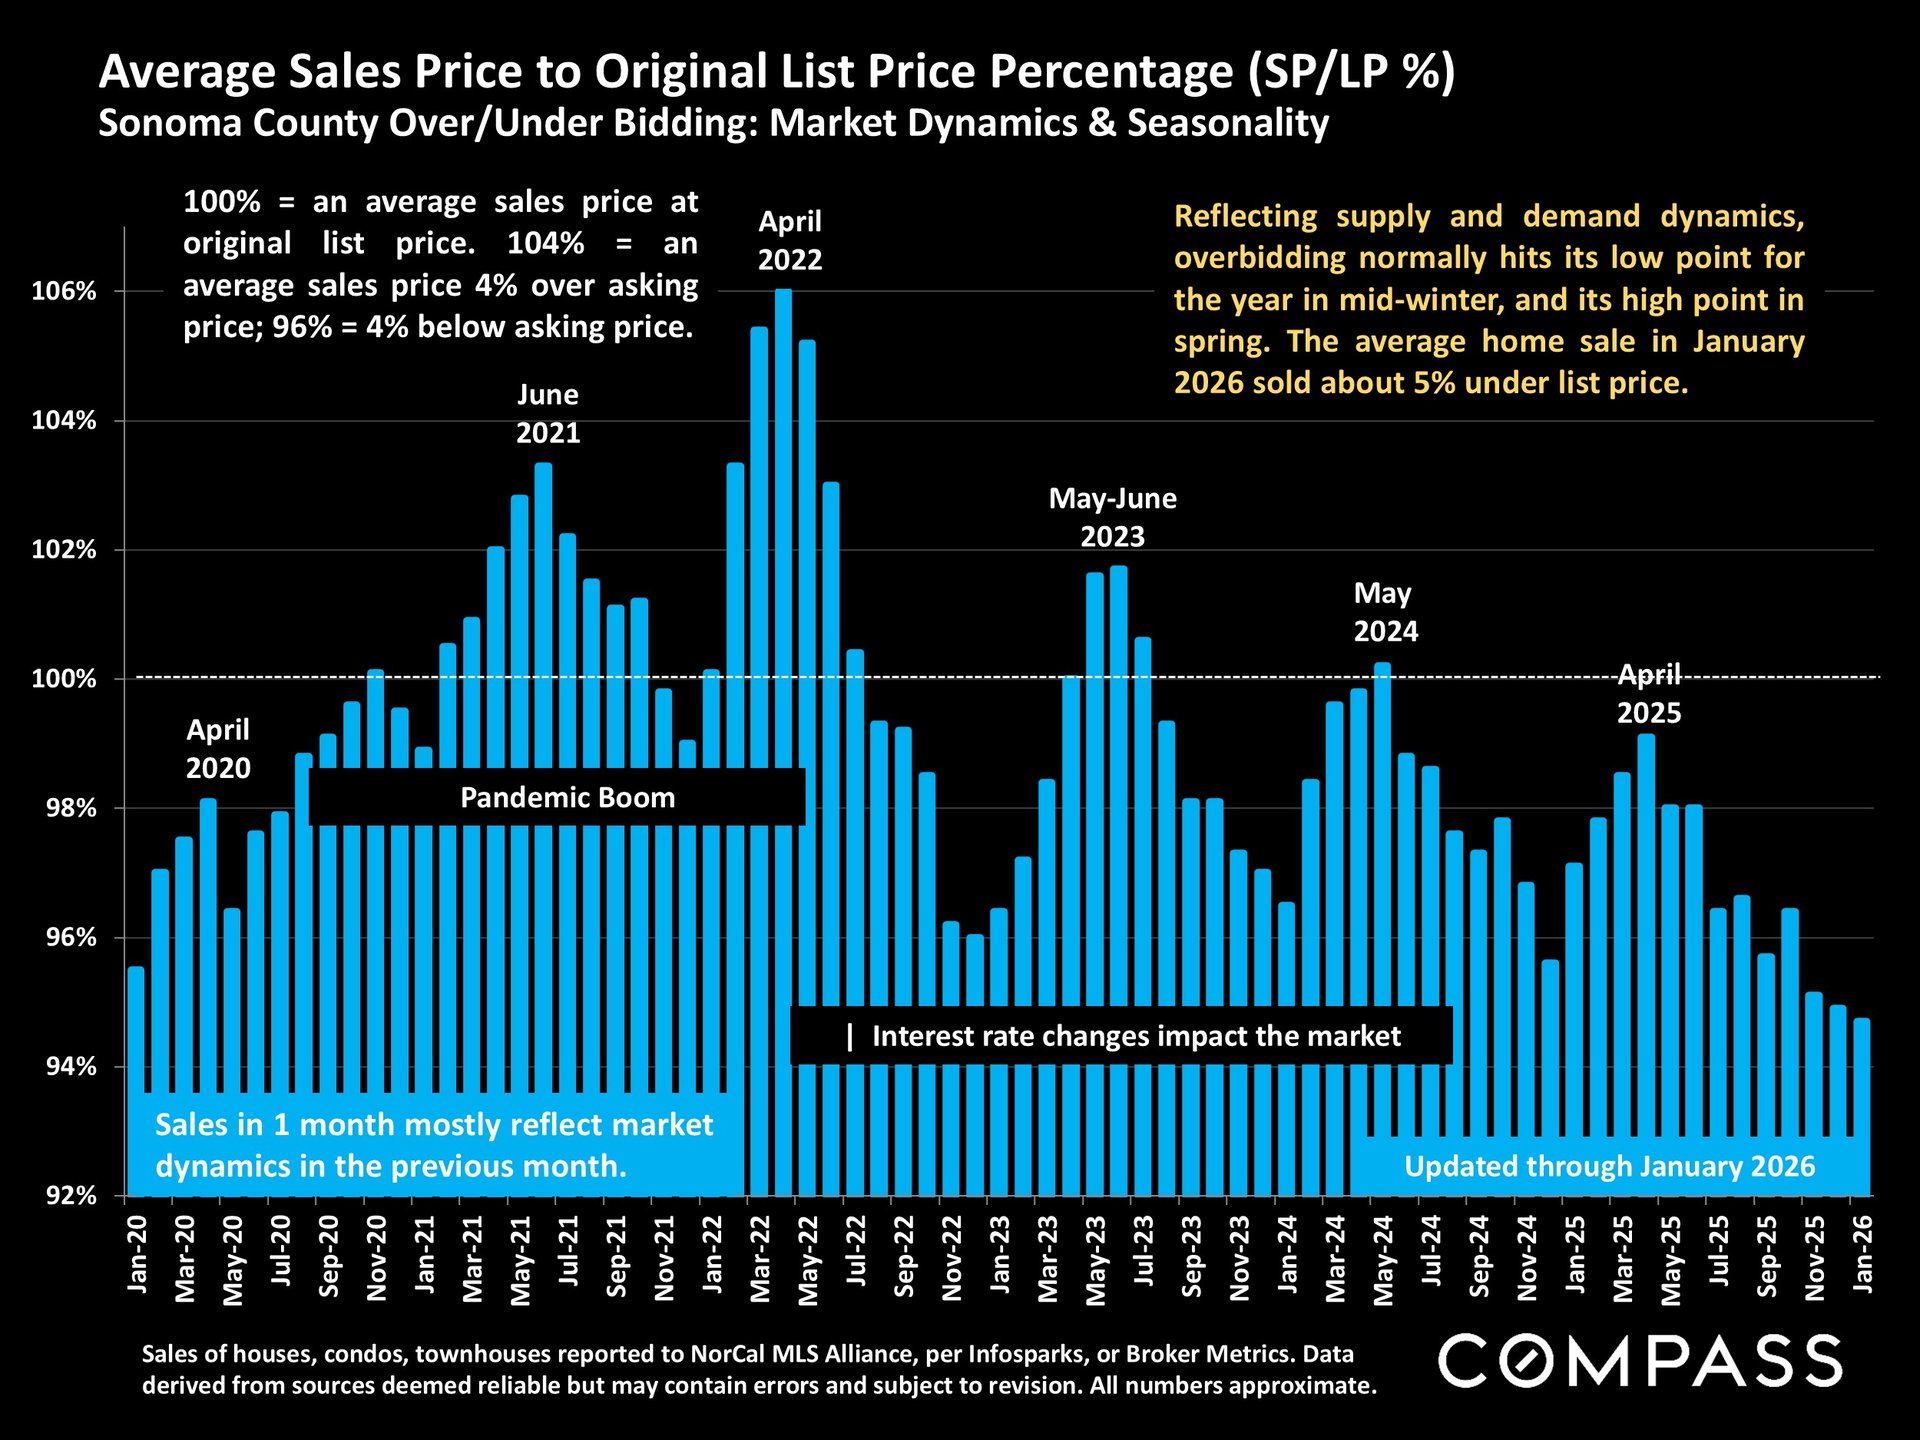
This graph is very telling as we see the how the average price to sales price has plummeted in Sonoma County since last Spring. This spells caution for sellers. Private Exclusive and Coming Soon can be good tools to test the market before going on to the MLS.
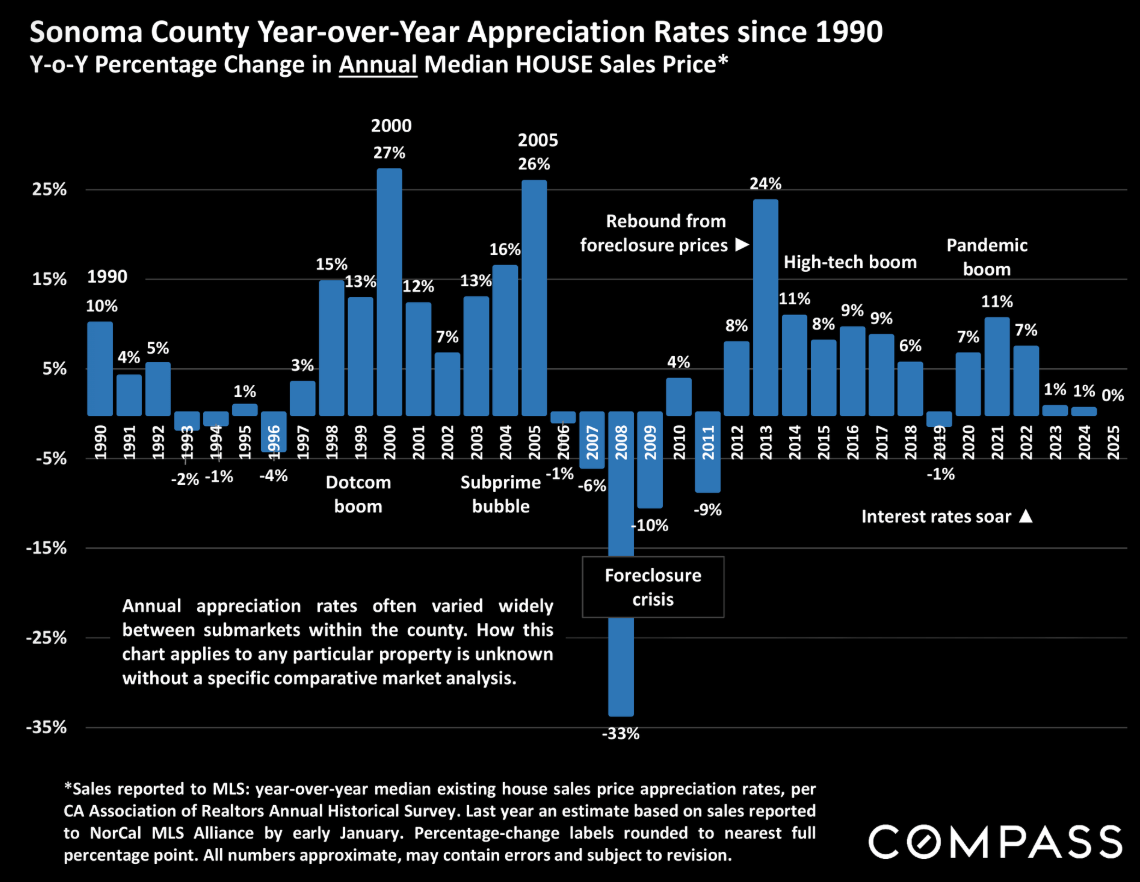
Since 2023, Sonoma County's appreciation has been fairly flat.