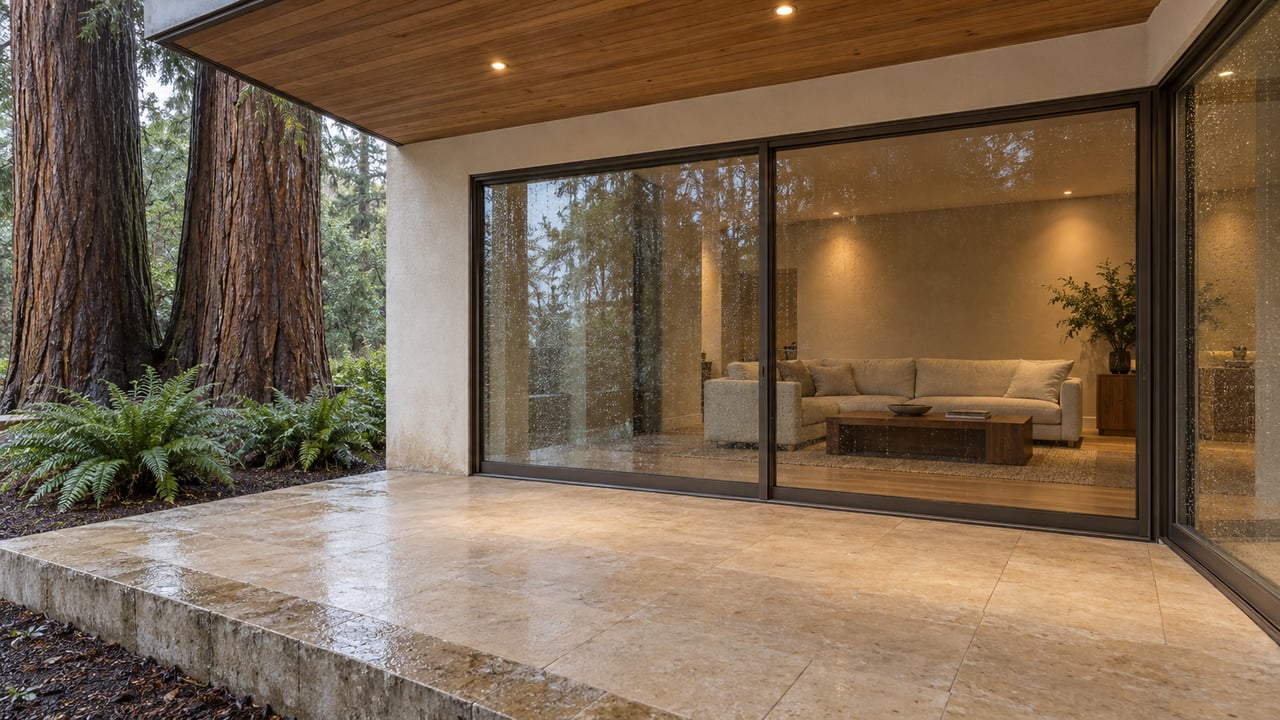
We're in the grip of the spring market. Regional activity has picked up. We're seeing encouraging sales activity in the face of economic data that is mixed at best with higher rates. Nonetheless, buyers are out there and sellers are bringing their best foot forward.
See below for select market data that we think helps paint the picture. If you're interested in seeing our full slide-deck, reach out!


Our Perspective -- Spring is in full swing. During this time of year everything accelerates along with the overall supply of homes into the market. New sellers enter to attract the advent of buyers before the summer. Inventory has jumped substantially, but it's not at last year's level.

Our Perspective -- Across the county, we're seeing signs of buyer activity in the face of upward moving interest rates. This level of demand, we speculate, is due to some carry-over from 2025 when buyers were on the fence and "waiting to see" how market conditions would unfold.

Our Perspective -- It's interesting to see this area by area breakdown of Days on Market. While county wide data is useful, it's worth noting that different areas have their own trends and behaviors. Real Estate, as we like to say, is Hyper Local.
Santa Rosa is trending above the average... there is more inventory and competition than most other areas.

Our Perspective -- As recent sellers know, the pricing process since early 2025 has had it's ups and downs. Proper pricing has never been more important. In our market, if you're not strategic and measured you can miss-out on initial buyer interest.
These recent numbers show how sellers have adjusted to new market dynamics, and the market is meeting them accordingly.
We've dug deeper into the market data, and we see that the higher the list price, the lower the List to Sales ratio.